NetFlix 2010 Annual Report Download - page 28
Download and view the complete annual report
Please find page 28 of the 2010 NetFlix annual report below. You can navigate through the pages in the report by either clicking on the pages listed below, or by using the keyword search tool below to find specific information within the annual report.-
 1
1 -
2
-
3
-
4
-
5
-
6
-
7
-
8
-
9
-
10
-
11
-
12
-
13
-
14
-
15
-
16
-
17
-
 18
18 -
 19
19 -
 20
20 -
 21
21 -
 22
22 -
 23
23 -
 24
24 -
 25
25 -
 26
26 -
 27
27 -
 28
28 -
 29
29 -
 30
30 -
 31
31 -
 32
32 -
 33
33 -
 34
34 -
 35
35 -
 36
36 -
 37
37 -
 38
38 -
39
-
40
-
41
-
42
-
43
-
44
-
45
-
46
-
47
-
48
-
49
-
50
-
51
-
52
-
53
-
54
-
55
-
56
-
57
-
58
-
59
-
60
-
61
-
62
-
63
-
64
-
65
-
66
-
67
-
68
-
69
-
70
-
71
-
72
-
73
-
74
-
75
-
76
 |
 |

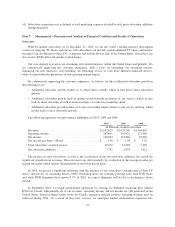
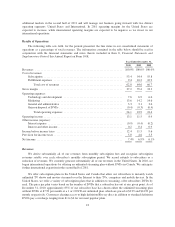
Fulfillment Expenses
Fulfillment expenses represent those expenses incurred in content processing, including operating and
staffing our shipping centers, as well as receiving, encoding, inspecting and warehousing our content library.
Fulfillment expenses also include operating and staffing our customer service centers and credit card fees.
Year ended December 31, Change
2010 2009 2010 vs. 2009
(in thousands, except percentages)
Fulfillment expenses ................................. $203,246 $169,810 19.7%
As a percentage of revenues ........................... 9.4% 10.2%
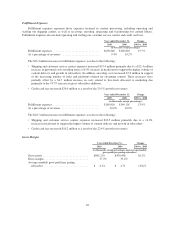
The $33.4 million increase in fulfillment expenses was due to the following:
• Shipping and customer service centers expenses increased $13.4 million primarily due to a $12.4 million
increase in personnel costs resulting from a 10.0% increase in headcount to support the higher volume of
content delivery and growth in subscribers. In addition, encoding costs increased $7.0 million in support
of the increasing number of titles and platforms offered for streaming content. These increases were
partially offset by a $4.7 million increase in costs related to free-trials allocated to marketing due
primarily to the 74.7% increase in gross subscriber additions.
• Credit card fees increased $20.0 million as a result of the 29.5% growth in revenues.
Year ended December 31, Change
2009 2008 2009 vs. 2008
(in thousands, except percentages)
Fulfillment expenses ................................. $169,810 $149,101 13.9%
As a percentage of revenues ........................... 10.2% 10.9%
The $20.7 million increase in fulfillment expenses was due to the following:
• Shipping and customer service centers expenses increased $10.5 million primarily due to a 14.0%
increase in headcount to support the higher volume of content delivery and growth in subscribers.
• Credit card fees increased $10.2 million as a result of the 22.4% growth in revenues.
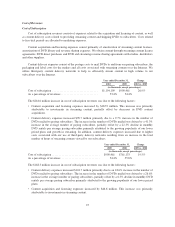
Gross Margin
Year ended December 31, Change
2010 2009 2010 vs. 2009
(in thousands, except percentages and average monthly
gross profit per paying subscriber)
Gross profit ................................ $805,270 $590,998 36.3%
Gross margin ............................... 37.2% 35.4%
Average monthly gross profit per paying
subscriber ............................... $ 4.54 $ 4.71 (3.6)%
26