NetFlix 2010 Annual Report Download - page 48
Download and view the complete annual report
Please find page 48 of the 2010 NetFlix annual report below. You can navigate through the pages in the report by either clicking on the pages listed below, or by using the keyword search tool below to find specific information within the annual report.-
 1
1 -
2
-
3
-
4
-
5
-
6
-
7
-
8
-
9
-
10
-
11
-
12
-
13
-
14
-
15
-
16
-
17
-
18
-
19
-
20
-
21
-
22
-
23
-
24
-
25
-
26
-
27
-
28
-
29
-
30
-
31
-
32
-
33
-
34
-
35
-
36
-
37
-
 38
38 -
 39
39 -
 40
40 -
 41
41 -
 42
42 -
 43
43 -
 44
44 -
 45
45 -
 46
46 -
 47
47 -
 48
48 -
 49
49 -
 50
50 -
 51
51 -
 52
52 -
 53
53 -
 54
54 -
 55
55 -
 56
56 -
 57
57 -
 58
58 -
59
-
60
-
61
-
62
-
63
-
64
-
65
-
66
-
67
-
68
-
69
-
70
-
71
-
72
-
73
-
74
-
75
-
76
 |
 |

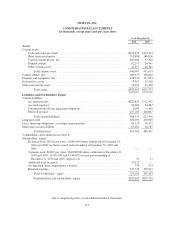
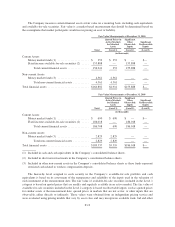
NETFLIX, INC.
CONSOLIDATED STATEMENTS OF OPERATIONS
(in thousands, except per share data)
Year ended December 31,
2010 2009 2008
Revenues .................................................. $2,162,625 $1,670,269 $1,364,661
Cost of revenues:
Subscription ............................................ 1,154,109 909,461 761,133
Fulfillment expenses ..................................... 203,246 169,810 149,101
Total cost of revenues ................................ 1,357,355 1,079,271 910,234
Gross profit ................................................ 805,270 590,998 454,427
Operating expenses:
Technology and development .............................. 163,329 114,542 89,873
Marketing ............................................. 293,839 237,744 199,713
General and administrative ................................ 70,555 51,333 49,662
Gain on disposal of DVDs ................................ (6,094) (4,560) (6,327)
Total operating expenses .............................. 521,629 399,059 332,921
Operating income ........................................... 283,641 191,939 121,506
Other income (expense):
Interest expense ......................................... (19,629) (6,475) (2,458)
Interest and other income ................................. 3,684 6,728 12,452
Income before income taxes ................................... 267,696 192,192 131,500
Provision for income taxes .................................... 106,843 76,332 48,474
Net income ................................................ $ 160,853 $ 115,860 $ 83,026
Net income per share:
Basic ................................................. $ 3.06 $ 2.05 $ 1.36
Diluted ................................................ $ 2.96 $ 1.98 $ 1.32
Weighted-average common shares outstanding:
Basic ................................................. 52,529 56,560 60,961
Diluted ................................................ 54,304 58,416 62,836
See accompanying notes to consolidated financial statements.
F-4