NetFlix 2003 Annual Report Download - page 77
Download and view the complete annual report
Please find page 77 of the 2003 NetFlix annual report below. You can navigate through the pages in the report by either clicking on the pages listed below, or by using the keyword search tool below to find specific information within the annual report.-
 1
1 -
2
-
3
-
4
-
5
-
6
-
7
-
8
-
9
-
10
-
11
-
12
-
13
-
14
-
15
-
16
-
17
-
18
-
19
-
20
-
21
-
22
-
23
-
24
-
25
-
26
-
27
-
28
-
29
-
30
-
31
-
32
-
33
-
34
-
35
-
36
-
37
-
38
-
39
-
40
-
41
-
42
-
43
-
44
-
45
-
46
-
47
-
48
-
49
-
50
-
51
-
52
-
53
-
54
-
55
-
56
-
57
-
58
-
59
-
60
-
61
-
62
-
63
-
64
-
65
-
66
-
 67
67 -
 68
68 -
 69
69 -
 70
70 -
 71
71 -
 72
72 -
 73
73 -
 74
74 -
 75
75 -
 76
76 -
 77
77 -
 78
78 -
 79
79 -
 80
80 -
 81
81 -
 82
82 -
 83
83 -
 84
84 -
 85
85 -
 86
86 -
 87
87
 |
 |

NETFLIX, INC.
NOTES TO FINANCIAL STATEMENTS—(Continued)
(in thousands, except share, per share and per DVD data)
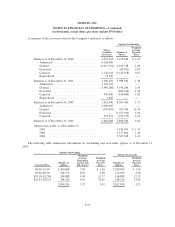
A summary of the activities related to the Company’s options is as follows:
Shares
Available
for Grant
Options Outstanding
Number of
Shares
Weighted-
Average
Exercise
Price
Balances as of December 31, 2000 ................ 1,072,518 2,278,038 $ 3.72
Authorized ............................... 6,266,666 — —
Granted .................................. (6,915,318) 6,915,318 1.60
Exercised ................................ — (60,092) 2.07
Canceled ................................. 3,134,318 (3,134,318) 3.67
Repurchased .............................. 11,250 — —
Balances as of December 31, 2001 ................ 3,569,434 5,998,946 1.49
Authorized ............................... 1,333,334 — —
Granted .................................. (3,540,286) 3,540,286 2.05
Exercised ................................ — (882,166) 1.48
Canceled ................................. 456,006 (456,006) 1.82
Repurchased .............................. 3,458 — —
Balances as of December 31, 2002 ................ 1,821,946 8,201,060 1.71
Authorized ............................... 2,000,000 — —
Granted .................................. (705,030) 705,030 16.78
Exercised ................................ — (2,657,934) 1.86
Canceled ................................. 351,572 (351,572) 2.24
Balances as of December 31, 2003 ................ 3,468,488 5,896,584 3.42
Options exercisable as of December 31:
2001 .................................... 1,836,504 $ 1.47
2002 .................................... 2,577,066 1.49
2003 .................................... 3,367,308 4.21
The following table summarizes information on outstanding and exercisable options as of December 31,
2003:
Options Outstanding
Options Exercisable
Exercise Price
Number of
Options
Weighted-
Average
Remaining
Contractual
Life (Years)
Weighted-
Average
Exercise
Price
Number of
Options
Weighted-
Average
Exercise
Price
$0.08–$1.50 4,760,608 7.69 $ 1.50 2,768,093 $ 1.50
$3.00–$8.56 548,774 8.63 4.40 114,013 4.58
$10.18–$12.48 248,888 9.44 11.77 146,888 12.35
$16.83–$29.23 338,314 9.81 22.65 338,314 22.65
5,896,584 7.97 3.42 3,367,308 4.21
F-19