NetFlix 2003 Annual Report Download - page 37
Download and view the complete annual report
Please find page 37 of the 2003 NetFlix annual report below. You can navigate through the pages in the report by either clicking on the pages listed below, or by using the keyword search tool below to find specific information within the annual report.-
 1
1 -
2
-
3
-
4
-
5
-
6
-
7
-
8
-
9
-
10
-
11
-
12
-
13
-
14
-
15
-
16
-
17
-
18
-
19
-
20
-
21
-
22
-
23
-
24
-
25
-
26
-
 27
27 -
 28
28 -
 29
29 -
 30
30 -
 31
31 -
 32
32 -
 33
33 -
 34
34 -
 35
35 -
 36
36 -
 37
37 -
 38
38 -
 39
39 -
 40
40 -
 41
41 -
 42
42 -
 43
43 -
 44
44 -
 45
45 -
 46
46 -
 47
47 -
48
-
49
-
50
-
51
-
52
-
53
-
54
-
55
-
56
-
57
-
58
-
59
-
60
-
61
-
62
-
63
-
64
-
65
-
66
-
67
-
68
-
69
-
70
-
71
-
72
-
73
-
74
-
75
-
76
-
77
-
78
-
79
-
80
-
81
-
82
-
83
-
84
-
85
-
86
-
87
 |
 |

television advertising into the mix of acquisition channels to grow our subscriber base. However, we believe that
online and word-of-mouth advertising will continue to be the primary sources of generating the bulk of new
subscribers in 2004.
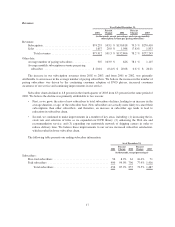
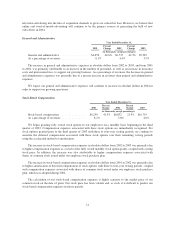
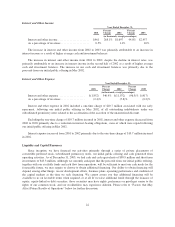
General and Administrative
Year Ended December 31,
2001
Percent
Change 2002
Percent
Change 2003
(in thousands, except percentages)
General and administrative ................... $4,658 44.6% $6,737 42.3% $9,585
As a percentage of revenues .................. 6.1% 4.4% 3.5%
The increase in general and administrative expenses in absolute dollars from 2002 to 2003, and from 2001
to 2002, was primarily attributable to an increase in the number of personnel, as well as an increase in insurance
costs and professional fees, to support our growing business. As a percentage of revenues, the decrease in general
and administrative expenses was primarily due to a greater increase in revenues than general and administrative
expenses.
We expect our general and administrative expenses will continue to increase in absolute dollars in 2004 in
order to support our growing operations.
Stock-Based Compensation
Year Ended December 31,
2001
Percent
Change 2002
Percent
Change 2003
(in thousands, except percentages)
Stock-based compensation .................. $6,250 41.3% $8,832 21.4% $10,719
As a percentage of revenues ................. 8.2% 5.8% 4.0%
We began granting fully vested stock options to our employees on a monthly basis beginning in the third
quarter of 2003. Compensation expenses associated with these stock options are immediately recognized. For
stock options granted prior to the third quarter of 2003 with three to four-year vesting periods, we continue to
amortize the deferred compensation associated with these stock options over their remaining vesting periods
using the accelerated method of amortization.
The increase in stock-based compensation expenses in absolute dollars from 2002 to 2003 was primarily due
to higher compensation expenses as a result of the fully vested monthly stock option grants, coupled with a rising
stock price. In addition, the increase was also attributable to higher compensation expenses associated with
shares of common stock issued under our employee stock purchase plan.
The increase in stock-based compensation expenses in absolute dollars from 2001 to 2002 was primarily due
to higher amortization of deferred compensation of stock options with three to four-year vesting periods, coupled
with compensation expenses associated with shares of common stock issued under our employee stock purchase
plan, which was adopted during 2002.
The calculation of our stock-based compensation expenses is highly sensitive to the market price of our
common stock on the date of grant. Our stock price has been volatile and, as such, it is difficult to predict our
stock-based compensation expenses in future periods.
21