NetFlix 2003 Annual Report Download - page 62
Download and view the complete annual report
Please find page 62 of the 2003 NetFlix annual report below. You can navigate through the pages in the report by either clicking on the pages listed below, or by using the keyword search tool below to find specific information within the annual report.-
 1
1 -
2
-
3
-
4
-
5
-
6
-
7
-
8
-
9
-
10
-
11
-
12
-
13
-
14
-
15
-
16
-
17
-
18
-
19
-
20
-
21
-
22
-
23
-
24
-
25
-
26
-
27
-
28
-
29
-
30
-
31
-
32
-
33
-
34
-
35
-
36
-
37
-
38
-
39
-
40
-
41
-
42
-
43
-
44
-
45
-
46
-
47
-
48
-
49
-
50
-
51
-
 52
52 -
 53
53 -
 54
54 -
 55
55 -
 56
56 -
 57
57 -
 58
58 -
 59
59 -
 60
60 -
 61
61 -
 62
62 -
 63
63 -
 64
64 -
 65
65 -
 66
66 -
 67
67 -
 68
68 -
 69
69 -
 70
70 -
 71
71 -
 72
72 -
73
-
74
-
75
-
76
-
77
-
78
-
79
-
80
-
81
-
82
-
83
-
84
-
85
-
86
-
87
 |
 |

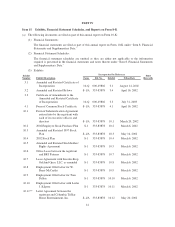
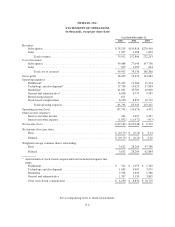
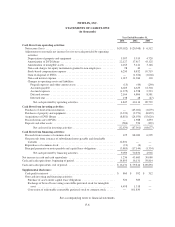
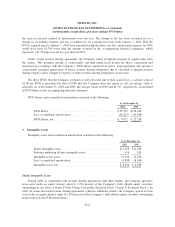
NETFLIX, INC.
STATEMENTS OF OPERATIONS
(in thousands, except per share data)
Year Ended December 31,
2001 2002 2003
Revenues:
Subscription ................................................ $74,255 $150,818 $270,410
Sales ...................................................... 1,657 1,988 1,833
Totalrevenues ........................................... 75,912 152,806 272,243
Cost of revenues:
Subscription ................................................ 49,088 77,044 147,736
Sales ...................................................... 819 1,092 624
Totalcostofrevenues ..................................... 49,907 78,136 148,360
Grossprofit ..................................................... 26,005 74,670 123,883
Operating expenses:
Fulfillment* ................................................. 13,452 19,366 31,274
Technology and development* .................................. 17,734 14,625 17,884
Marketing* ................................................. 21,031 35,783 49,949
General and administrative* .................................... 4,658 6,737 9,585
Restructuring charges ......................................... 671 — —
Stock-based compensation ..................................... 6,250 8,832 10,719
Total operating expenses ................................... 63,796 85,343 119,411
Operating income (loss) ........................................... (37,791) (10,673) 4,472
Other income (expense):
Interest and other income ...................................... 461 1,697 2,457
Interest and other expense ...................................... (1,852) (11,972) (417)
Netincome(loss) ................................................ $(39,182) $ (20,948) $ 6,512
Net income (loss) per share:
Basic ...................................................... $ (10.73) $ (0.74) $ 0.14
Diluted..................................................... $ (10.73) $ (0.74) $ 0.10
Weighted-average common shares outstanding:
Basic ...................................................... 3,652 28,204 47,786
Diluted..................................................... 3,652 28,204 62,884
* Amortization of stock-based compensation not included in expense line
items:
Fulfillment .................................................. $ 542 $ 1,055 $ 1,349
Technology and development ................................... 1,865 3,007 3,979
Marketing .................................................. 2,506 1,640 1,586
General and administrative ..................................... 1,337 3,130 3,805
Total stock-based compensation ................................. $ 6,250 $ 8,832 $ 10,719
See accompanying notes to financial statements.
F-4