NetFlix 2003 Annual Report Download - page 33
Download and view the complete annual report
Please find page 33 of the 2003 NetFlix annual report below. You can navigate through the pages in the report by either clicking on the pages listed below, or by using the keyword search tool below to find specific information within the annual report.-
 1
1 -
2
-
3
-
4
-
5
-
6
-
7
-
8
-
9
-
10
-
11
-
12
-
13
-
14
-
15
-
16
-
17
-
18
-
19
-
20
-
21
-
22
-
 23
23 -
 24
24 -
 25
25 -
 26
26 -
 27
27 -
 28
28 -
 29
29 -
 30
30 -
 31
31 -
 32
32 -
 33
33 -
 34
34 -
 35
35 -
 36
36 -
 37
37 -
 38
38 -
 39
39 -
 40
40 -
 41
41 -
 42
42 -
 43
43 -
44
-
45
-
46
-
47
-
48
-
49
-
50
-
51
-
52
-
53
-
54
-
55
-
56
-
57
-
58
-
59
-
60
-
61
-
62
-
63
-
64
-
65
-
66
-
67
-
68
-
69
-
70
-
71
-
72
-
73
-
74
-
75
-
76
-
77
-
78
-
79
-
80
-
81
-
82
-
83
-
84
-
85
-
86
-
87
 |
 |

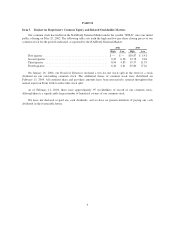
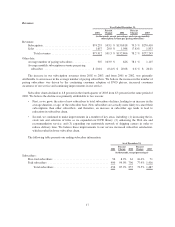
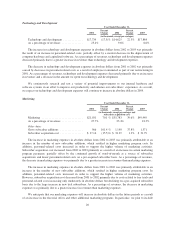
Revenues
Year Ended December 31,
2001
Percent
Change 2002
Percent
Change 2003
(in thousands, except percentages and average monthly
subscription revenue per paying subscriber)
Revenues:
Subscription ................................. $74,255 103.1 % $150,818 79.3 % $270,410
Sales ...................................... 1,657 20.0% 1,988 (7.8)% 1,833
Totalrevenues ........................... $75,912 101.3 % $152,806 78.2 % $272,243
Other data:
Average number of paying subscribers ............ 307 103.9 % 626 78.1 % 1,115
Average monthly subscription revenue per paying
subscriber ................................ $ 20.16 (0.4)% $ 20.08 0.6% $ 20.21
The increase in our subscription revenues from 2002 to 2003, and from 2001 to 2002, was primarily
attributable to an increase in the average number of paying subscribers. We believe the increase in the number of
paying subscribers was driven by the continuing consumer adoption of DVD players, increased consumer
awareness of our service and continuing improvements in our service.
Subscriber churn declined to 4.8 percent in the fourth quarter of 2003 from 6.3 percent in the same period of
2002. We believe the decline was primarily attributable to two reasons:
• First, as we grow, the ratio of new subscribers to total subscribers declines, leading to an increase in the
average duration, or age, of the subscriber base. New subscribers are actually more likely to cancel their
subscriptions than older subscribers, and therefore, an increase in subscriber age tends to lead to
reductions in subscriber churn.
• Second, we continued to make improvements in a number of key areas, including: (1) increasing the in-
stock rate and selection of titles as we expanded our DVD library; (2) enhancing the Web site and
recommendation service; and (3) expanding our nationwide network of shipping centers in order to
reduce delivery time. We believe these improvements to our service increased subscriber satisfaction,
which resulted in lower subscriber churn.
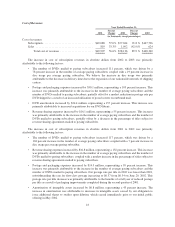
The following table presents our ending subscriber information:
As of December 31,
2001
Percent
Change 2002
Percent
Change 2003
(in thousands, except percentages)
Subscribers:
Free-trial subscribers ...................................... 56 8.9% 61 16.4% 71
Paid subscribers .......................................... 400 99.0% 796 77.9% 1,416
Total subscribers ...................................... 456 87.9% 857 73.5% 1,487
17