NetFlix 2003 Annual Report Download - page 38
Download and view the complete annual report
Please find page 38 of the 2003 NetFlix annual report below. You can navigate through the pages in the report by either clicking on the pages listed below, or by using the keyword search tool below to find specific information within the annual report.-
 1
1 -
2
-
3
-
4
-
5
-
6
-
7
-
8
-
9
-
10
-
11
-
12
-
13
-
14
-
15
-
16
-
17
-
18
-
19
-
20
-
21
-
22
-
23
-
24
-
25
-
26
-
27
-
 28
28 -
 29
29 -
 30
30 -
 31
31 -
 32
32 -
 33
33 -
 34
34 -
 35
35 -
 36
36 -
 37
37 -
 38
38 -
 39
39 -
 40
40 -
 41
41 -
 42
42 -
 43
43 -
 44
44 -
 45
45 -
 46
46 -
 47
47 -
 48
48 -
49
-
50
-
51
-
52
-
53
-
54
-
55
-
56
-
57
-
58
-
59
-
60
-
61
-
62
-
63
-
64
-
65
-
66
-
67
-
68
-
69
-
70
-
71
-
72
-
73
-
74
-
75
-
76
-
77
-
78
-
79
-
80
-
81
-
82
-
83
-
84
-
85
-
86
-
87
 |
 |

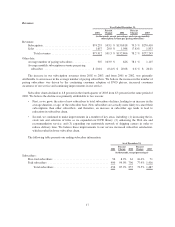
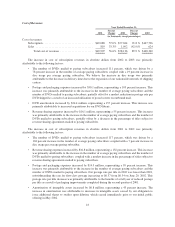
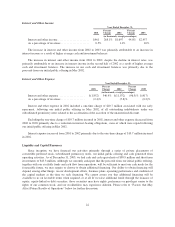
Interest and Other Income
Year Ended December 31,
2001
Percent
Change 2002
Percent
Change 2003
(in thousands, except percentages)
Interest and other income ...................... $461 268.1% $1,697 44.8% $2,457
As a percentage of revenues .................... 0.5% 1.1% 1.0%
The increase in interest and other income from 2002 to 2003 was primarily attributable to an increase in
interest income as a result of higher average cash and investment balances.
The increase in interest and other income from 2001 to 2002, despite the decline in interest rates, was
primarily attributable to an increase in interest income in the second half of 2002 as a result of higher average
cash and investment balances. The increase in our cash and investment balances was primarily due to the
proceeds from our initial public offering in May 2002.
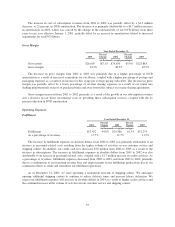
Interest and Other Expense
Year Ended December 31,
2001
Percent
Change 2002
Percent
Change 2003
(in thousands, except percentages)
Interest and other expense .................. $(1,852) 546.4% $(11,972) (96.5)% $(417)
As a percentage of revenues ................. (2.4)% (7.8)% (0.2)%
Interest and other expense in 2002 included a one-time charge of $10.7 million associated with our early
repayment, following our initial public offering in May 2002, of all outstanding indebtedness under our
subordinated promissory notes related to the acceleration of the accretion of the unamortized discount.
Excluding the one-time charge of $10.7 million incurred in 2002, interest and other expense decreased from
2002 to 2003 primarily due to a reduction in interest-bearing obligations, some of which were repaid following
our initial public offering in May 2002.
Interest expense increased from 2001 to 2002 primarily due to the one-time charge of $10.7 million incurred
in 2002.
Liquidity and Capital Resources
Since inception, we have financed our activities primarily through a series of private placements of
convertible preferred stock, subordinated promissory notes, our initial public offering and cash generated from
operating activities. As of December 31, 2003, we had cash and cash equivalents of $89.9 million and short-term
investments of $45.3 million. Although we currently anticipate that the proceeds from our initial public offering,
together with our available funds and cash flow from operations, will be sufficient to meet our cash needs for the
foreseeable future, we may require or choose to obtain additional financing. Our ability to obtain financing will
depend, among other things, on our development efforts, business plans, operating performance and condition of
the capital markets at the time we seek financing. We cannot assure you that additional financing will be
available to us on favorable terms when required, or at all. If we raise additional funds through the issuance of
equity, equity-linked or debt securities, those securities may have rights, preferences or privileges senior to the
rights of our common stock, and our stockholders may experience dilution. Please refer to “Factors that May
Affect Future Results of Operations” below for further discussion.
22