NetFlix 2003 Annual Report Download - page 36
Download and view the complete annual report
Please find page 36 of the 2003 NetFlix annual report below. You can navigate through the pages in the report by either clicking on the pages listed below, or by using the keyword search tool below to find specific information within the annual report.-
 1
1 -
2
-
3
-
4
-
5
-
6
-
7
-
8
-
9
-
10
-
11
-
12
-
13
-
14
-
15
-
16
-
17
-
18
-
19
-
20
-
21
-
22
-
23
-
24
-
25
-
 26
26 -
 27
27 -
 28
28 -
 29
29 -
 30
30 -
 31
31 -
 32
32 -
 33
33 -
 34
34 -
 35
35 -
 36
36 -
 37
37 -
 38
38 -
 39
39 -
 40
40 -
 41
41 -
 42
42 -
 43
43 -
 44
44 -
 45
45 -
 46
46 -
47
-
48
-
49
-
50
-
51
-
52
-
53
-
54
-
55
-
56
-
57
-
58
-
59
-
60
-
61
-
62
-
63
-
64
-
65
-
66
-
67
-
68
-
69
-
70
-
71
-
72
-
73
-
74
-
75
-
76
-
77
-
78
-
79
-
80
-
81
-
82
-
83
-
84
-
85
-
86
-
87
 |
 |

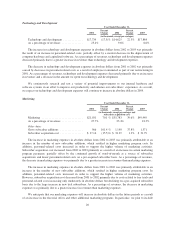
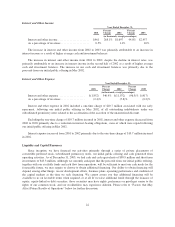
Technology and Development
Year Ended December 31,
2001
Percent
Change 2002
Percent
Change 2003
(in thousands, except percentages)
Technology and development .............. $17,734 (17.5)% $14,625 22.3% $17,884
As a percentage of revenues ............... 23.4% 9.6% 6.6%
The increase in technology and development expenses in absolute dollars from 2002 to 2003 was primarily
the result of an increase in personnel-related costs, partially offset by a modest decrease in the depreciation of
computer hardware and capitalized software. As a percentage of revenues, technology and development expenses
decreased primarily due to a greater increase in revenues than technology and development expenses.
The decrease in technology and development expenses in absolute dollars from 2001 to 2002 was primarily
caused by decreases in personnel-related costs as a result of employees terminated as part of our restructuring in
2001. As a percentage of revenues, technology and development expenses decreased primarily due to an increase
in revenues and a decrease in the amount we spent on technology and development.
We continuously research and test a variety of potential improvements to our internal hardware and
software systems in an effort to improve our productivity and enhance our subscribers’ experience. As a result,
we expect our technology and development expenses will continue to increase in absolute dollars in 2004.
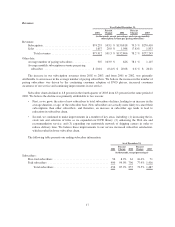
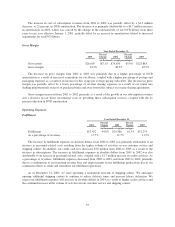
Marketing
Year Ended December 31,
2001
Percent
Change 2002
Percent
Change 2003
(in thousands, except percentages and
subscriber acquisition cost)
Marketing ............................. $21,031 70.1 % $35,783 39.6% $49,949
As a percentage of revenues ............... 27.7% 23.4% 18.3%
Other data:
Gross subscriber additions ................ 566 101.4 % 1,140 37.8% 1,571
Subscriber acquisition cost ................ $ 37.16 (15.5)% $ 31.39 1.3% $ 31.79
The increase in marketing expenses in absolute dollars from 2002 to 2003 was primarily attributable to an
increase in the number of new subscriber additions, which resulted in higher marketing program costs. In
addition, personnel-related costs increased in order to support the higher volume of marketing activities.
Subscriber acquisition cost increased from 2002 to 2003 primarily as a result of an increase in certain marketing
program payments, partially offset by the continued growth of word-of-mouth as a source of subscriber
acquisitions and lower personnel-related costs on a per-acquired subscriber basis. As a percentage of revenues,
the decrease in marketing expenses was primarily due to a greater increase in revenues than marketing expenses.
The increase in marketing expenses in absolute dollars from 2001 to 2002 was primarily attributable to an
increase in the number of new subscriber additions, which resulted in higher marketing program costs. In
addition, personnel-related costs increased in order to support the higher volume of marketing activities.
However, subscriber acquisition cost decreased from 2001 to 2002 primarily due to costs related to free trials and
personnel-related costs increasing only moderately in absolute dollars but declining on a per-acquired subscriber
basis due to the large increase in new trial subscribers. As a percentage of revenues, the decrease in marketing
expenses was primarily due to a greater increase in revenues than marketing expenses.
We anticipate that our marketing expenses will increase in absolute dollars in the future periods as a result
of an increase in the free-trial offers and other additional marketing programs. In particular, we plan to include
20