Mazda 2012 Annual Report Download - page 56
Download and view the complete annual report
Please find page 56 of the 2012 Mazda annual report below. You can navigate through the pages in the report by either clicking on the pages listed below, or by using the keyword search tool below to find specific information within the annual report.-
 1
1 -
2
-
3
-
4
-
5
-
6
-
7
-
8
-
9
-
10
-
11
-
12
-
13
-
14
-
15
-
16
-
17
-
18
-
19
-
20
-
21
-
22
-
23
-
24
-
25
-
26
-
27
-
28
-
29
-
30
-
31
-
32
-
33
-
34
-
35
-
36
-
37
-
38
-
39
-
40
-
41
-
42
-
43
-
44
-
45
-
 46
46 -
 47
47 -
 48
48 -
 49
49 -
 50
50 -
 51
51 -
 52
52 -
 53
53 -
 54
54 -
 55
55 -
 56
56 -
 57
57 -
 58
58 -
 59
59 -
 60
60
 |
 |

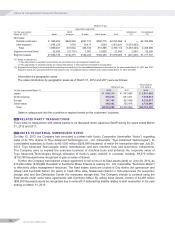
Millions of yen
Reportable segments
Adjustment
(*1)
Consolidated
(*2)
For the year ended
March 31, 2011 Japan
North
America Europe Other areas Total
Net sales:
Outside customers ¥ 965,203 ¥623,990 ¥427,721 ¥308,775 ¥2,325,689 ¥ — ¥2,325,689
Inter-segment 1,034,278 7,054 10,471 1,620 1,053,423 (1,053,423) —
Total 1,999,481 631,044 438,192 310,395 3,379,112 (1,053,423) 2,325,689
Segment income/(loss) 32,555 (31,731) 7,901 12,820 21,545 2,290 23,835
Segment assets ¥1,566,139 ¥142,415 ¥162,003 ¥108,448 ¥1,979,005 ¥ (207,238) ¥1,771,767
(*1) Notes on adjustment:
(1) The adjustment on segment income/(loss) are eliminations of inter-segment transactions.
(2) The adjustment on segment assets are mainly eliminations of inter-segment receivables and payables.
(*2) Segment income/(loss) is reconciled with the operating income/(loss) in the consolidated statement of operations for the years ended March 31, 2012 and 2011.
Segment assets are reconciled with the total assets in the consolidated balance sheets for the years ended March 31, 2012 and 2011.
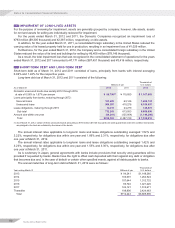
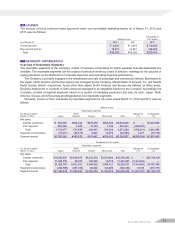
Information by geographic areas
The sales information by geographic areas as of March 31, 2012 and 2011 were as follows:
Millions of yen
Thousands of
U.S. dollars
For the years ended March 31 2012 2011 2012
Japan ¥ 560,216 ¥ 541,490 $ 6,831,902
North America 575,633 631,327 7,019,915
Europe 347,346 427,398 4,235,927
Other areas 549,863 725,474 6,705,646
Total ¥2,033,058 ¥2,325,689 $24,793,390
Sales is categorized into the countries or regions based on the customers’ locations.
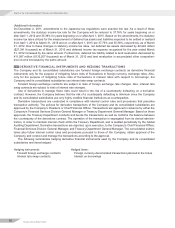
18 RELATED PARTY TRANSACTIONS
There were no transactions with related parties to be disclosed under Japanese GAAP during the years ended March
31, 2012 and 2011.
19 NOTES TO MATERIAL SUBSEQUENT EVENT
On May 15, 2012, the Company had concluded a contract with Itochu Corporation (hereinafter “Itochu”) regarding
sales of its 70% shares in Toyo Advanced Technologies Co., Ltd. (hereinafter “Toyo Advanced Technologies”), its
consolidated subsidiary, to Itochu by ¥21,000 million ($256,098 thousand), of which the transaction date was July 20,
2012. Toyo Advanced Technologies mainly manufactures and sells machine tools and automotive components.
The Company aims to expand the overseas business of machine tools and enhance the corporate value of
Toyo Advanced Technologies through utilization of Itochu’s sales network in overseas markets. ¥9,575 million
($116,768 thousand) was recognized in gain on sales of shares.
Further, the Company had reached a basic agreement to sell some of its fixed assets (land) on June 29, 2012, by
¥13,939 million ($169,988 thousand) to Sumitomo Mitsui Finance & Leasing Co., Ltd. (hereinafter “Sumitomo Mitsui”)
to effectively utilize management resources. The fixed assets (land) are located in Ozu district (for gymnasium and
others) and Fuchizaki district (for plant) in head office area, Nakanoseki district in Hofu-plant area (for temporary
storage site) and Sue Distribution Center (for temporary storage site). The Company intends to continue using the
fixed assets under some lease agreements with Sumitomo Mitsui. By selling these assets, income of ¥4,469 million
($54,500 thousand) would be recognized due to write-off of deferred tax liability related to land revaluation in the year
ending on March 31, 2013.
Notes to Consolidated Financial Statements
Mazda Annual Report 2012
54