Mazda 2012 Annual Report Download - page 4
Download and view the complete annual report
Please find page 4 of the 2012 Mazda annual report below. You can navigate through the pages in the report by either clicking on the pages listed below, or by using the keyword search tool below to find specific information within the annual report.-
 1
1 -
 2
2 -
 3
3 -
 4
4 -
 5
5 -
 6
6 -
 7
7 -
 8
8 -
 9
9 -
 10
10 -
 11
11 -
 12
12 -
 13
13 -
 14
14 -
 15
15 -
16
-
17
-
18
-
19
-
20
-
21
-
22
-
23
-
24
-
25
-
26
-
27
-
28
-
29
-
30
-
31
-
32
-
33
-
34
-
35
-
36
-
37
-
38
-
39
-
40
-
41
-
42
-
43
-
44
-
45
-
46
-
47
-
48
-
49
-
50
-
51
-
52
-
53
-
54
-
55
-
56
-
57
-
58
-
59
-
60
 |
 |

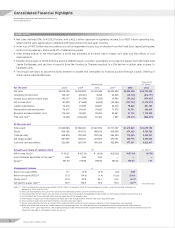
Millions of yen
Thousands of
U.S. dollars*1
For the year 2008 2009 2010 2011*72012 2012
Net sales ¥3,475,789 ¥2,535,902 ¥2,163,949 ¥2,325,689 ¥2,033,058 $24,793,390
Operating income (loss) 162,147 (28,381) 9,458 23,835 (38,718) (472,171)
Income (loss) before income taxes 143,117 (51,339) (7,265) 16,081 (55,262) (673,927)
Net income (loss) 91,835 (71,489) (6,478) (60,042) (107,733) (1,313,817)
Capital expenditures 75,518 81,838 29,837 44,722 78,040 951,707
Depreciation and amortization 74,217 84,043 76,428 71,576 68,791 838,915
Research and development costs 114,400 95,967 85,206 90,961 91,716 1,118,488
Free cash flow*210,209 (129,244) 67,394 1,627 (79,415) (968,475)
At the year-end
Total assets ¥1,985,566 ¥1,800,981 ¥1,947,769 ¥1,771,767 ¥1,915,943 $23,365,159
Equity 554,154 414,731 509,815 430,539 474,429 5,785,720
Financial debt 504,979 753,355 722,128 693,000 778,085 9,488,841
Net financial debt 281,085 532,631 375,825 370,151 300,778 3,668,024
Cash and cash equivalents 223,894 220,724 346,303 322,849 477,307 5,820,817
Amounts per share of common stock Yen U.S. dollars*1
Net income (loss)*3¥ 65.21 ¥ (52.13) ¥ (4.26) ¥ (33.92) ¥ (57.80) $(0.70)
Cash dividends applicable to the year*46.00 3.00 3.00 — — —
Equity*5391.82 314.98 286.92 242.24 156.85 1.91
Management indexes %
Return on assets (ROA) 4.7 (3.8) (0.3) (3.2) (5.8)
Return on equity (ROE)*617.9 (14.8) (1.4) (12.8) (24.0)
Equity ratio*627.8 22.9 26.1 24.2 26.3*8
Net debt-to-equity ratio*650.9 128.9 74.0 86.3 52.7*8
Notes: *1. The translation of the Japanese yen amounts into U.S. dollars is presented solely for the convenience of readers, using the prevailing exchange rate
on March 31, 2012, of ¥82 to US$1.
*2. Free cash flow represents the sum of net cash flows from operating activities and from investing activities.
*3. The computations of net income (loss) per share of common stock are based on the weighted-average number of shares outstanding during each fiscal year.
*4. Cash dividends per share represent actual amounts applicable to the respective year.
*5. The amounts of equity used in the calculation of equity per share exclude minority interests and stock acquisition rights.
*6. The amounts of equity exclude minority interests and stock acquisition rights.
* 7. Results information for the fiscal year March 2011 includes 15-month results for certain overseas subsidiaries that changed their fiscal year-end.
*8. Ratio after taking into account the capital nature of the subordinated loan. This subordinated loan is recognized by Rating and Investment Information, Inc.,
as having a 50% capital equivalence. Not including the equity capital attributes of the subordinated loan, the shareholders’ equity ratio was 24.5% and the ratio of net
interest bearing debt to shareholders’ equity was 64.2%.
Consolidated Financial Highlights
Mazda Motor Corporation and Consolidated Subsidiaries
Years ended March 31
( ) indicates minus
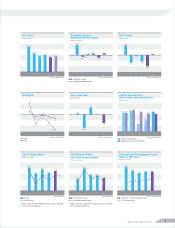
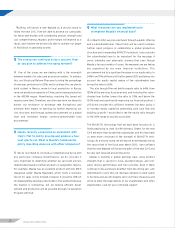
Net sales declined 13%, to ¥2,033.1 billion, with a ¥62.6 billion decrease in operating income, to a ¥38.7 billion operating loss,
reflecting the yen’s appreciation combined with lower production and sales volumes.
A net loss of ¥107.7 billion was recorded as a result of impairment losses, loss on disaster from the Great East Japan Earthquake,
restructuring expenses, and a write-off of deferred tax assets.
After hitting bottom in the third quarter, a profit was achieved at all levels due to higher unit sales and the effects of cost
improvements.
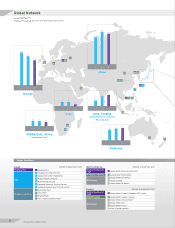
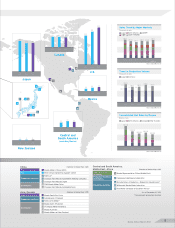
Despite strong sales in North America and the ASEAN region, economic uncertainty in Europe, the impact from the Great East
Japan Earthquake, and declines in exports from the flooding in Thailand resulted in a 2% decline in global sales volume, to
1,247,000 units.
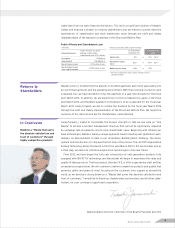
The Group took steps to secure the funds needed for growth and strengthen its financial position through a public offering of
shares and a subordinated loan.
Mazda Annual Report 2012
2
HIGHLIGHTS