Mazda 2012 Annual Report Download - page 38
Download and view the complete annual report
Please find page 38 of the 2012 Mazda annual report below. You can navigate through the pages in the report by either clicking on the pages listed below, or by using the keyword search tool below to find specific information within the annual report.-
 1
1 -
2
-
3
-
4
-
5
-
6
-
7
-
8
-
9
-
10
-
11
-
12
-
13
-
14
-
15
-
16
-
17
-
18
-
19
-
20
-
21
-
22
-
23
-
24
-
25
-
26
-
27
-
 28
28 -
 29
29 -
 30
30 -
 31
31 -
 32
32 -
 33
33 -
 34
34 -
 35
35 -
 36
36 -
 37
37 -
 38
38 -
 39
39 -
 40
40 -
 41
41 -
 42
42 -
 43
43 -
 44
44 -
 45
45 -
 46
46 -
 47
47 -
 48
48 -
49
-
50
-
51
-
52
-
53
-
54
-
55
-
56
-
57
-
58
-
59
-
60
 |
 |

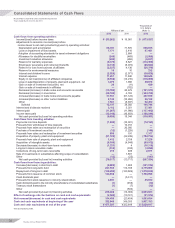
Consolidated Statements of Cash Flows
Mazda Motor Corporation and Consolidated Subsidiaries
Years ended March 31, 2012 and 201 1
Millions of yen
Thousands of
U.S. dollars
(Note 1)
2012 2011 2012
Cash flows from operating activities:
Income/(loss) before income taxes ¥ (55,262) ¥ 16,081 $ (673,927)
Adjustments to reconcile income/(loss) before
income taxes to net cash provided by/(used in) operating activities:
Depreciation and amortization 68,791 71,576 838,915
Loss on impairment of fixed assets 7,171 3,416 87,451
Adoption of accounting standards for asset retirement obligations —2,684 —
Allowance for doubtful receivables (245) (469) (2,988)
Investment valuation allowance (495) (262) (6,037)
Reserve for warranty expenses (9,378) 5,627 (114,366)
Employees’ severance and retirement benefits (2,134) (6,074) (26,024)
Reserve for loss from business of affiliates (2,327) 4,136 (28,378)
Reserve for environmental measures 19 10 232
Interest and dividend income (2,528) (2,071) (30,829)
Interest expense 11,451 11,840 139,646
Equity in net loss/(income) of affiliated companies (9,552) (14,216) (116,488)
Loss on sale/disposition of property, plant and equipment, net 3,270 1,908 39,878
Gain on sale of investment securities, net 36 (11)439
Gain on sale of investments in affiliates —(702) —
Decrease/(increase) in trade notes and accounts receivable (15,709) 20,679 (191,573)
Decrease/(increase) in inventories (28,185) 4,763 (343,720)
Increase/(decrease) in trade notes and accounts payable 37,551 (61,124) 457,939
Increase/(decrease) in other current liabilities 2,142 (10,262) 26,122
Other 7,581 (8,947) 92,452
Subtotal 12,197 38,582 148,744
Interest and dividends received 3,112 5,351 37,951
Interest paid (11,267) (11,986) (137,402)
Income taxes paid (13,140) (16,603) (160,244)
Net cash provided by/(used in) operating activities (9,098) 15,344 (110,951)
Cash flows from investing activities:
Payments into time deposits (1,000) (10,001) (12,195)
Proceeds from withdrawal of time deposits —10,013 —
Proceeds from sales and redemption of securities —20,000 —
Purchase of investment securities (12) (1,229) (146)
Proceeds from sales and redemption of investment securities 600 191 7,317
Acquisition of property, plant and equipment (61,724) (32,249) (752,732)
Proceeds from sale of property, plant and equipment 1,412 2,758 17,220
Acquisition of intangible assets (8,160) (4,946) (99,512)
Decrease/(increase) in short-term loans receivable (1,321) 4(16,110)
Long-term loans receivable made (319) (330) (3,890)
Collections of long-term loans receivable 219 406 2,671
Sale of investments in subsidiaries affecting scope of consolidation —1,691 —
Other (12) (25) (147)
Net cash provided by/(used in) investing activities (70,317) (13,717) (857,524)
Cash flows from financing activities:
Increase/(decrease) in short-term debt (9,983) 1,605 (121,744)
Proceeds from long-term debt 227,550 114,169 2,775,000
Repayment of long-term debt (129,450) (123,826) (1,578,659)
Proceeds from issuance of common stock 144,656 — 1,764,098
Cash dividends paid —(5,311) —
Proceeds from stock issuance to minority shareholders 3,691 —45,012
Cash dividends paid to the minority shareholders of consolidated subsidiaries (1) (458) (12)
Treasury stock transactions (1) (7) (12)
Other —(532) —
Net cash provided by/(used in) financing activities 236,462 (14,360) 2,883,683
Effect of exchange rate fluctuations on cash and cash equivalents (2,589) (10,721) (31,574)
Net increase/(decrease) in cash and cash equivalents 154,458 (23,454) 1,883,634
Cash and cash equivalents at beginning of the year 322,849 346,303 3,937,183
Cash and cash equivalents at end of the year ¥ 477,307 ¥322,849 $ 5,820,817
See accompanying notes.
Mazda Annual Report 2012
36