Mazda 2012 Annual Report Download - page 5
Download and view the complete annual report
Please find page 5 of the 2012 Mazda annual report below. You can navigate through the pages in the report by either clicking on the pages listed below, or by using the keyword search tool below to find specific information within the annual report.-
 1
1 -
 2
2 -
 3
3 -
 4
4 -
 5
5 -
 6
6 -
 7
7 -
 8
8 -
 9
9 -
 10
10 -
 11
11 -
 12
12 -
 13
13 -
 14
14 -
 15
15 -
 16
16 -
17
-
18
-
19
-
20
-
21
-
22
-
23
-
24
-
25
-
26
-
27
-
28
-
29
-
30
-
31
-
32
-
33
-
34
-
35
-
36
-
37
-
38
-
39
-
40
-
41
-
42
-
43
-
44
-
45
-
46
-
47
-
48
-
49
-
50
-
51
-
52
-
53
-
54
-
55
-
56
-
57
-
58
-
59
-
60
 |
 |
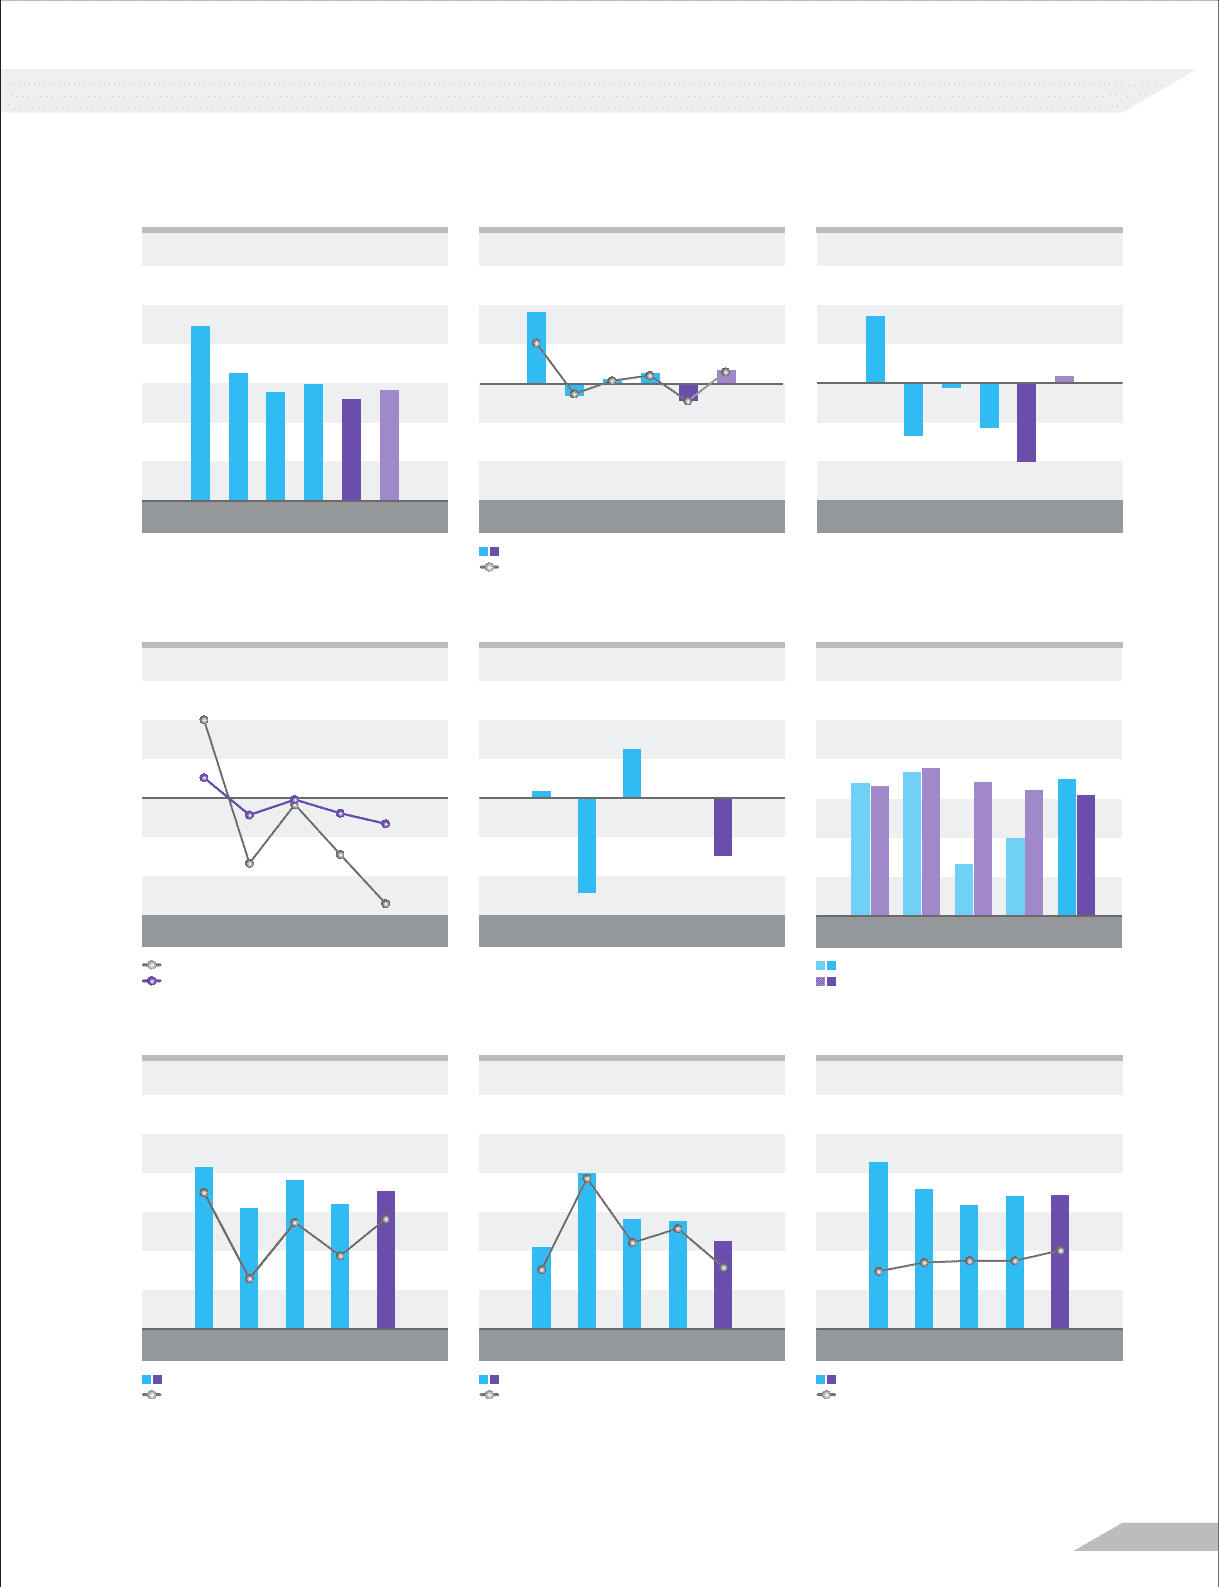
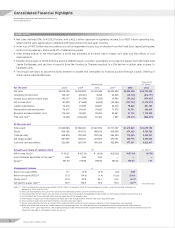
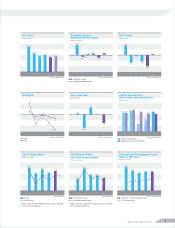
* Ratios after the recognition of equity capital attributes
of the subordinated loan.
* Ratios after the recognition of equity capital attributes
of the subordinated loan.
20092008
Net Sales
Billions of yen
2010 2011 2012 2013
(Outlook)
2,535.9
3,475.8
2,163.9 2,325.7
2,033.1 2,200.0
Operating Income/
Operating Income Margin
Billions of yen/%
(28.4)
162.1
9.5 23.8 30.0
(38.7)
(1.1)
4.7
0.4 1.0 1.4
(1.9)
20092008 2010 2011 2012 2013
(Outlook)
Net Income
Billions of yen
(71.5)
91.8
(6.5)
(60.0)
(107.7)
10.0
20092008 2010 2011 2012 2013
(Outlook)
ROE/ROA
%
2008 2009 2010 2011 2012
17.9
4.7
(3.8)
(0.3)
(3.2) (5.8)
(14.8)
(1.4)
(12.8)
(24.0)
2008
Free Cash Flow
Billions of yen
2009 2010 2011 2012
10.2
(129.2)
(79.4)
67.4
1.6
2008
Capital Expenditures/
Depreciation and Amortization
Billions of yen
2009 2010 2011 2012
75.5 74.2
81.8 84.0
29.8
76.4
44.7
71.6 68.8
78.0
Equity/Equity Ratio
Billions of yen/%
2008 2009 2010 2011 2012
554.2
414.7
509.8
430.5
474.4
27.8
22.9
26.1
24.2
26.3*
281.1
532.6
300.8
375.8 370.2
50.9
128.9
74.0
86.3
52.7*
Net Financial Debt/
Net Debt-to-equity Ratio
Billions of yen/%
2008 2009 2010 2011 2012
114.4
96.0
85.2 91.0 91.7
3.3 3.8 3.9 3.9 4.5
Research and Development Costs/
Share of Net Sales
Billions of yen/%
2008 2009 2010 2011 2012
Operating income
Operating income margin
Equity
Equity ratio
Net financial debt
Net debt-to-equity ratio
Research and development costs
Share of net sales
Capital expenditures
Depreciation and amortization
ROE
ROA
(Years ended March 31)
(Years ended March 31)
(Years ended March 31)(Years ended March 31)
(Years ended March 31)
(As of March 31)
(Years ended March 31)
(Years ended March 31)
(As of March 31)
Mazda Annual Report 2012 3