Mazda 2012 Annual Report Download - page 30
Download and view the complete annual report
Please find page 30 of the 2012 Mazda annual report below. You can navigate through the pages in the report by either clicking on the pages listed below, or by using the keyword search tool below to find specific information within the annual report.-
 1
1 -
2
-
3
-
4
-
5
-
6
-
7
-
8
-
9
-
10
-
11
-
12
-
13
-
14
-
15
-
16
-
17
-
18
-
19
-
 20
20 -
 21
21 -
 22
22 -
 23
23 -
 24
24 -
 25
25 -
 26
26 -
 27
27 -
 28
28 -
 29
29 -
 30
30 -
 31
31 -
 32
32 -
 33
33 -
 34
34 -
 35
35 -
 36
36 -
 37
37 -
 38
38 -
 39
39 -
 40
40 -
41
-
42
-
43
-
44
-
45
-
46
-
47
-
48
-
49
-
50
-
51
-
52
-
53
-
54
-
55
-
56
-
57
-
58
-
59
-
60
 |
 |
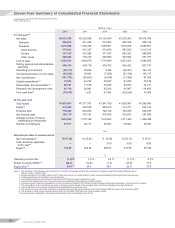
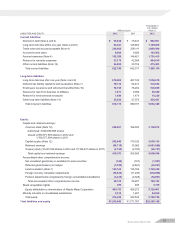
Eleven-Year Summary of Consolidated Financial Statements
ation and Consolidated Subsidiaries
Years ended March 31
Millions of yen
2012 2011 2010 2009 2008
For the year*2:
Net sales ¥2,033,058 ¥2,325,689 ¥2,163,949 ¥2,535,902 ¥3,475,789
Domestic 560,216 541,490 574,982 620,336 880,132
Overseas 1,472,842 1,784,199 1,588,967 1,915,566 2,595,657
North America 575,633 631,327 574,640 697,600 1,015,315
Europe 347,346 427,398 477,337 653,382 888,555
Other areas 549,863 725,474 536,990 564,584 691,787
Cost of sales 1,662,592 1,863,678 1,710,699 2,021,851 2,485,905
Selling, general and administrative
expenses 409,184 438,176 443,792 542,432 827,737
Operating income/(loss) (38,718) 23,835 9,458 (28,381) 162,147
Income/(loss) before income taxes (55,262) 16,081 (7,265) (51,339) 143,117
Net income/(loss) (107,733) (60,042) (6,478) (71,489) 91,835
Capital expenditures*378,040 44,722 29,837 81,838 75,518
Depreciation and amortization*468,791 71,576 76,428 84,043 74,217
Research and development costs 91,716 90,961 85,206 95,967 114,400
Free cash flow*5(79,415) 1,627 67,394 (129,244) 10,209
At the year-end:
Total assets ¥1,915,943 ¥1,771,767 ¥1,947,769 ¥1,800,981 ¥1,985,566
Equity*6474,429 430,539 509,815 414,731 554,154
Financial debt 778,085 693,000 722,128 753,355 504,979
Net financial debt 300,778 370,151 375,825 532,631 281,085
Average number of shares
outstanding (in thousands) 1,863,949 1,770,198 1,519,652 1,371,456 1,408,368
Number of employees 37,617 38,117 38,987 39,852 39,364
Yen
Amounts per share of common stock:
Net income/(loss)*7¥ (57.80) ¥ (33.92) ¥ (4.26) ¥ (52.13) ¥ 65.21
Cash dividends applicable
to the year*8—— 3.00 3.00 6.00
Equity*9156.85 242.24 286.92 314.98 391.82
%
Operating income ratio (1.9)% 1.0 % 0.4 % (1.1)% 4.7%
Return on equity (ROE)*10 (24.0) (12.8) (1.4) (14.8) 17.9
Equity ratio*10 24.5*11 24.2 26.1 22.9 27.8
Notes: 1. The translation of the Japanese yen amounts into U.S. dollars is presented solely for the convenience of readers, using the prevailing exchange rate on
March 31, 2012, of ¥82 to US$1.
2. Results information for the March 2004 and 2011 fiscal years include 15-month results for certain overseas subsidiaries that changed their fiscal year-end.
3. Capital expenditures are calculated on an accrual basis.
4. Amortization expenses are not included for the March 2007 fiscal year and preceding fiscal years.
5. Free cash flow represents the sum of net cash flows from operating activities and from investing activities.
6. Prior-year amounts have been reclassified to conform to figures for the March 2007 fiscal year and subsequent fiscal years presentation to include minority interests.
7. The computations of net income/(loss) per share of common stock are based on the average number of shares outstanding during each fiscal year.
8. Cash dividends per share represent actual amounts applicable to the respective years.
9. The amounts of equity used in the calculation of equity per share exclude minority interests (and, from the March 2007 fiscal year, stock acquisition rights).
10. The amounts of equity exclude minority interests (and, from the March 2007 fiscal year, stock acquisition rights).
11. Percentage after consideration of the equity credit attributes of the subordinated loan is 26.3%.
Mazda Annual Report 2012
28