Mazda 2012 Annual Report Download - page 33
Download and view the complete annual report
Please find page 33 of the 2012 Mazda annual report below. You can navigate through the pages in the report by either clicking on the pages listed below, or by using the keyword search tool below to find specific information within the annual report.-
 1
1 -
2
-
3
-
4
-
5
-
6
-
7
-
8
-
9
-
10
-
11
-
12
-
13
-
14
-
15
-
16
-
17
-
18
-
19
-
20
-
21
-
22
-
 23
23 -
 24
24 -
 25
25 -
 26
26 -
 27
27 -
 28
28 -
 29
29 -
 30
30 -
 31
31 -
 32
32 -
 33
33 -
 34
34 -
 35
35 -
 36
36 -
 37
37 -
 38
38 -
 39
39 -
 40
40 -
 41
41 -
 42
42 -
 43
43 -
44
-
45
-
46
-
47
-
48
-
49
-
50
-
51
-
52
-
53
-
54
-
55
-
56
-
57
-
58
-
59
-
60
 |
 |
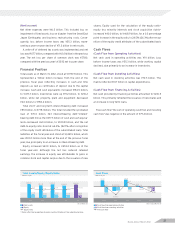
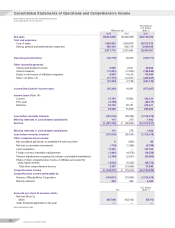
(Net Income)
Net other expenses were ¥16.5 billion. This included loss on
impairment of fixed assets, loss on disaster from the Great East
Japan Earthquake, and business restructuring costs. Conse-
quently, loss before income taxes was ¥55.3 billion, repre-
senting a year-on-year decline of ¥71.3 billion in net results.
A write-off of deferred tax assets was implemented, and net
loss was ¥107.7 billion, compared with ¥60.0 billion in the previous
year. The net loss per share of common stock was ¥57.80,
compared with the previous year’s ¥33.92 net loss per share.
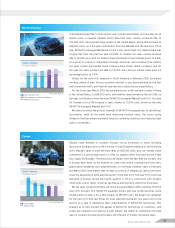
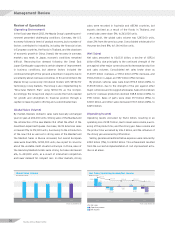
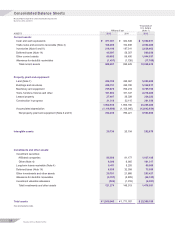
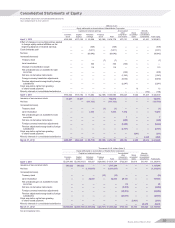
Financial Position
Total assets as of March 31, 2012, stood at ¥1,915.9 billion. This
represented a ¥144.2 billion increase from the end of the
previous fiscal year, reflecting increases in cash and time
deposits as well as certificates of deposit due to the capital
increase. Cash and cash equivalents increased ¥154.5 billion,
to ¥477.3 billion. Inventories were up ¥19.2 billion, to ¥216.2
billion, while net property, plant and equipment decreased
¥2.0 billion, to ¥784.2 billion.
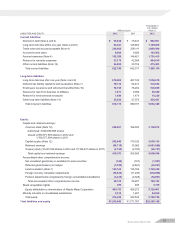
Total short- and long-term interest-bearing debt increased
¥85.1 billion, to ¥778.1 billion. This total included the syndicated
loan of ¥70.0 billion. Net interest-bearing debt—interest-
bearing debt minus the ¥477.3 billion of cash and cash equiva-
lents—decreased ¥69.4 billion, to ¥300.8 billion, and the net
debt-to-equity ratio stood at 64.2%. (52.7% after recognition
of the equity credit attributes of the subordinated loan). Total
liabilities at the fiscal year-end stood at ¥1,441.5 billion, which
was ¥100.3 billion more than at the end of the previous fiscal
year, due principally to an increase in interest-bearing debt.
Equity increased ¥43.9 billion, to ¥474.4 billion as of the
fiscal year-end. Although the net loss reduced retained
earnings, the increase in equity was attributable to gains in
common stock and capital surplus due to the issuance of new
shares. Equity used for the calculation of the equity ratio—
equity less minority interests and stock acquisition rights—
increased ¥40.0 billion, to ¥468.9 billion, for a 0.3 percentage
point increase in the equity ratio, to 24.5% (26.3% after recog-
nition of the equity credit attributes of the subordinated loan).
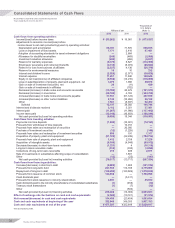
Cash Flows
(Cash Flow from Operating Activities)
Net cash used in operating activities was ¥9.1 billion. Loss
before income taxes was ¥55.3 billion, while working capital
declined, due primarily to an increase in inventories.
(Cash Flow from Investing Activities)
Net cash used in investing activities was ¥70.3 billion. This
mainly reflected ¥61.7 billion in capital expenditures.
(Cash Flow from Financing Activities)
Net cash provided by financing activities amounted to ¥236.5
billion. This primarily reflected the issuance of new shares and
an increase in long-term loans.
Free cash flow—the sum of operating cash flow and investing
cash flow—was negative in the amount of ¥79.4 billion.
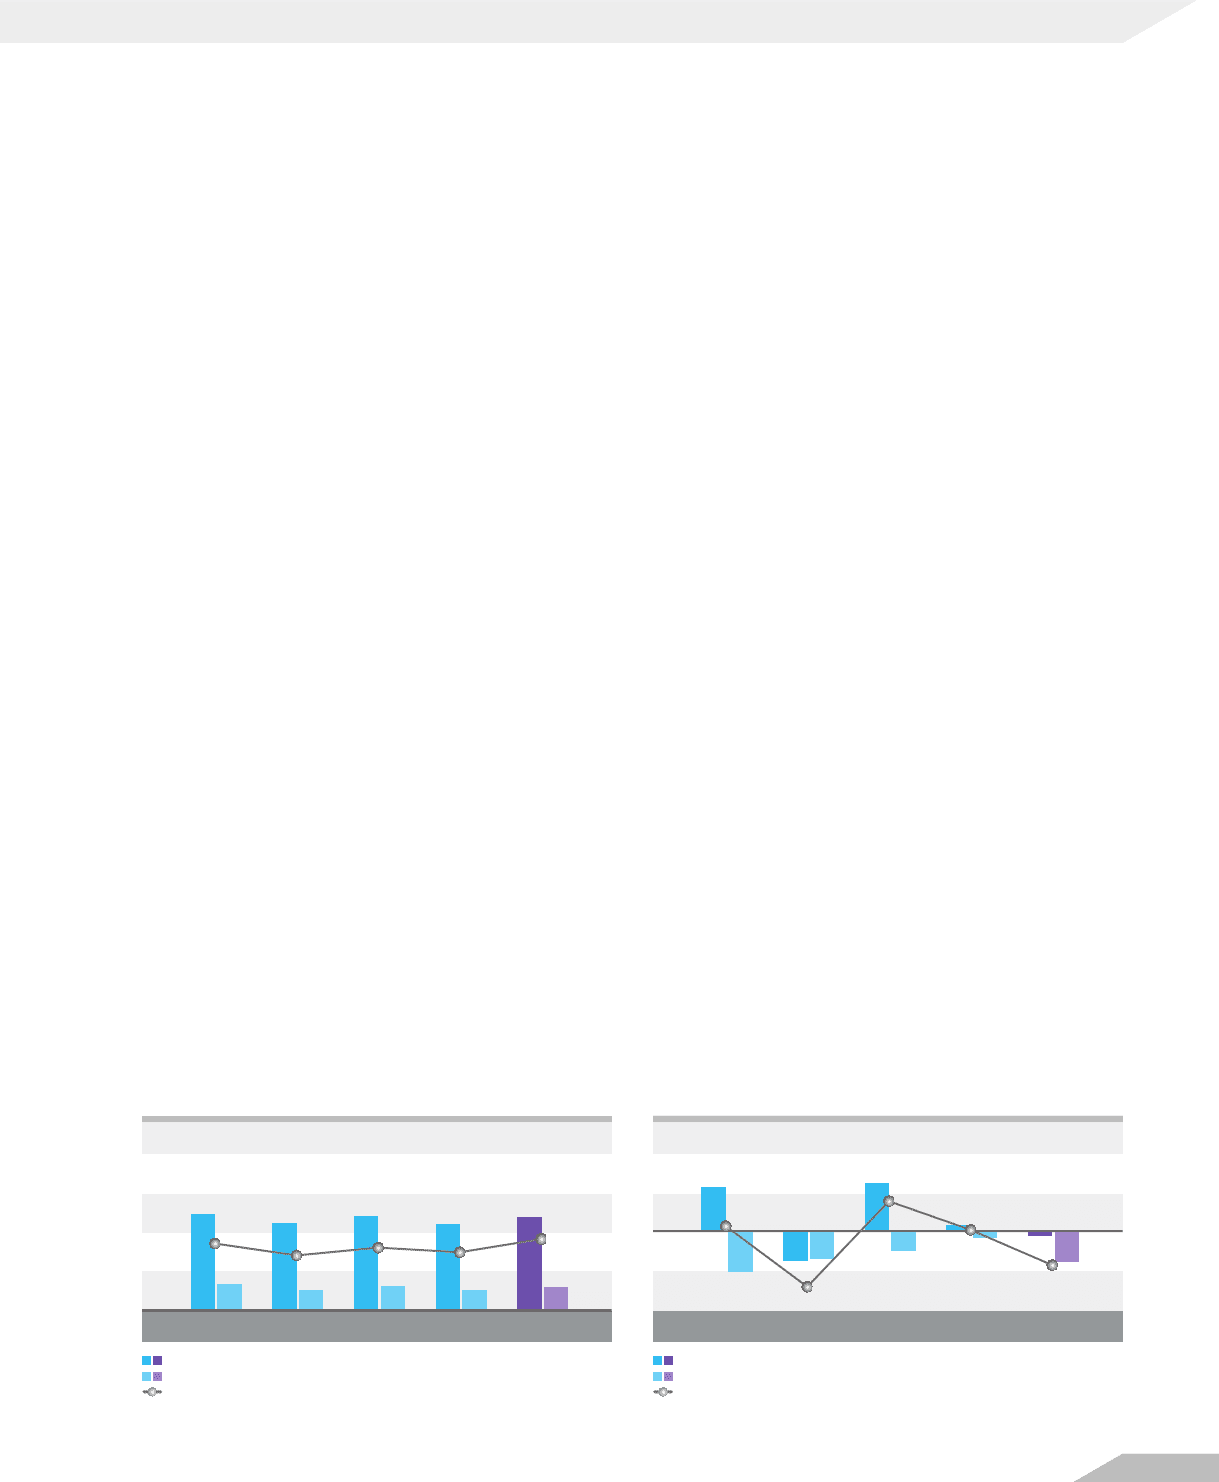
2008
Total Assets/Equity/Equity Ratio
Billions of yen
2009 2010 2011 2012
1,985.6 1,801.0 1,947.8 1,771.8 1,915.9
554.2 414.7 509.8 430.5 474.4
27.8 22.9 26.1 24.2 26.3*
2008
Cash Flows
Billions of yen
2009 2010 2011 2012
103.0
(67.4)(61.8)
(44.3)
(92.8) (70.3)
111.6
15.3
(9.1)
(13.7)
10.2
67.4
(129.2)
(79.4)
1.6
Total assets
Equity
Equity ratio
* Ratios after the recognition of equity capital attributes of the subordinated loan.
Cash flow from operating activities
Cash flow from investing activities
Free cash flow
(As of March 31) (Years ended March 31)
Mazda Annual Report 2012 31