Mazda 2012 Annual Report Download - page 55
Download and view the complete annual report
Please find page 55 of the 2012 Mazda annual report below. You can navigate through the pages in the report by either clicking on the pages listed below, or by using the keyword search tool below to find specific information within the annual report.-
 1
1 -
2
-
3
-
4
-
5
-
6
-
7
-
8
-
9
-
10
-
11
-
12
-
13
-
14
-
15
-
16
-
17
-
18
-
19
-
20
-
21
-
22
-
23
-
24
-
25
-
26
-
27
-
28
-
29
-
30
-
31
-
32
-
33
-
34
-
35
-
36
-
37
-
38
-
39
-
40
-
41
-
42
-
43
-
44
-
 45
45 -
 46
46 -
 47
47 -
 48
48 -
 49
49 -
 50
50 -
 51
51 -
 52
52 -
 53
53 -
 54
54 -
 55
55 -
 56
56 -
 57
57 -
 58
58 -
 59
59 -
 60
60
 |
 |

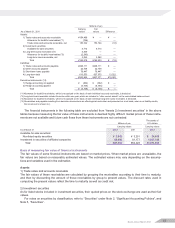
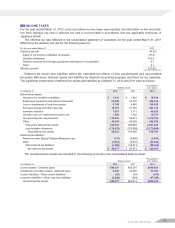
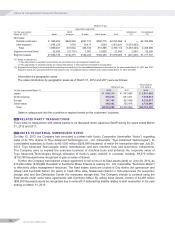
16 LEASES
The amount of future minimum lease payments under non-cancellable operating leases as of March 31, 2012 and
2011 were as follows:
Millions of yen
Thousands of
U.S. dollars
As of March 31 2012 2011 2012
Current portion ¥ 4,920 ¥ 3,618 $ 60,000
Non-current portion 13,873 12,551 169,183
Total ¥18,793 ¥16,169 $229,183
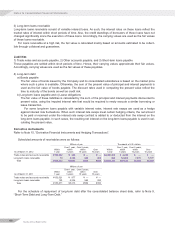
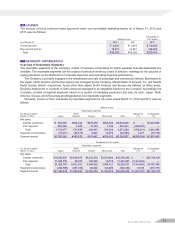
17 SEGMENT INFORMATION
Overview of Reportable Segments
The reportable segments of the Company consist of business components for which separate financial statements are
available. The reportable segments are the subject of periodical review by board of directors’ meetings for the purpose of
making decisions on the distribution of corporate resources and evaluating business performance.
The Company is primarily engaged in the manufacture and sale of passenger and commercial vehicles. Businesses in
the Japan, North America and Europe regions are managed by the Company, Mazda Motor of America, Inc. and Mazda
Motor Europe GmbH, respectively. Areas other than Japan, North America, and Europe are defined as Other areas.
Business deployment in countries in Other areas are managed in an integrated manner by the Company. Accordingly, the
Company consists of regional segments based on a system of managing production and sale. As such, Japan, North
America, Europe, and Other areas are designated as four reportable segments.
Net sales, income or loss, and assets by reportable segments for the years ended March 31, 2012 and 2011 were as
follows:
Millions of yen
Reportable segments
Adjustment
(*1)
Consolidated
(*2)
For the year ended
March 31, 2012 Japan
North
America Europe Other areas Total
Net sales:
Outside customers ¥ 824,383 ¥568,340 ¥347,299 ¥293,036 ¥2,033,058 ¥ — ¥2,033,058
Inter-segment 920,594 3,305 13,142 1,190 938,231 (938,231) —
Total 1,744,977 571,645 360,441 294,226 2,971,289 (938,231) 2,033,058
Segment income/(loss) (18,417) (40,277) 5,627 10,072 (42,995) 4,277 (38,718)
Segment assets ¥1,750,262 ¥162,676 ¥161,487 ¥126,532 ¥2,200,957 ¥(285,014) ¥1,915,943
Thousands of U.S. dollars
Reportable segments
Adjustment
(*1)
Consolidated
(*2)
For the year ended
March 31, 2012 Japan
North
America Europe Other areas Total
Net sales:
Outside customers $10,053,451 $6,930,976 $4,235,354 $3,573,609 $24,793,390
$
—
$24,793,390
Inter-segment 11,226,756 40,305 160,268 14,512 11,441,841
(11,441,841)
—
Total 21,280,207 6,971,281 4,395,622 3,588,121 36,235,231
(11,441,841)
24,793,390
Segment income/(loss) (224,598) (491,183) 68,622 122,829 (524,330)
52,159
(472,171)
Segment assets $21,344,659 $1,983,854 $1,969,354 $1,543,073 $26,840,940
$ (3,475,781)
$23,365,159
Mazda Annual Report 2012 53