Macy's 2012 Annual Report Download - page 93
Download and view the complete annual report
Please find page 93 of the 2012 Macy's annual report below. You can navigate through the pages in the report by either clicking on the pages listed below, or by using the keyword search tool below to find specific information within the annual report.-
 1
1 -
2
-
3
-
4
-
5
-
6
-
7
-
8
-
9
-
10
-
11
-
12
-
13
-
14
-
15
-
16
-
17
-
18
-
19
-
20
-
21
-
22
-
23
-
24
-
25
-
26
-
27
-
28
-
29
-
30
-
31
-
32
-
33
-
34
-
35
-
36
-
37
-
38
-
39
-
40
-
41
-
42
-
43
-
44
-
45
-
46
-
47
-
48
-
49
-
50
-
51
-
52
-
53
-
54
-
55
-
56
-
57
-
58
-
59
-
60
-
61
-
62
-
63
-
64
-
65
-
66
-
67
-
68
-
69
-
70
-
71
-
72
-
73
-
74
-
75
-
76
-
77
-
78
-
79
-
80
-
81
-
82
-
 83
83 -
 84
84 -
 85
85 -
 86
86 -
 87
87 -
 88
88 -
 89
89 -
 90
90 -
 91
91 -
 92
92 -
 93
93 -
 94
94 -
 95
95 -
 96
96 -
 97
97 -
 98
98 -
 99
99 -
 100
100 -
 101
101 -
 102
102 -
 103
103 -
104
 |
 |

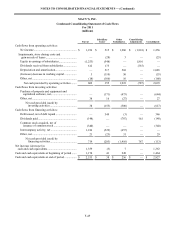
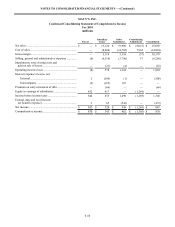
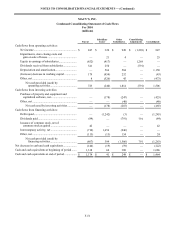
NOTES TO CONSOLIDATED FINANCIAL STATEMENTS — (Continued)
F-46
MACY’S, INC.
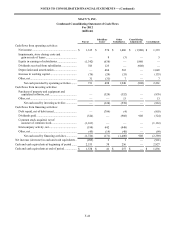
Condensed Consolidating Statement of Cash Flows
For 2012
(millions)
Parent Subsidiary
Issuer Other
Subsidiaries Consolidating
Adjustments Consolidated
Cash flows from operating activities:
Net income.............................................................. $ 1,335 $ 574 $ 1,406 $ (1,980) $ 1,335
Impairments, store closing costs and
gain on sale of leases........................................... — 8 (3) — 5
Equity in earnings of subsidiaries........................... (1,342)(638) — 1,980 —
Dividends received from subsidiaries..................... 783 125 — (908) —
Depreciation and amortization................................ — 484 565 — 1,049
Increase in working capital ..................................... (76)(24)(35) — (135)
Other, net................................................................. 31 (31) 7 — 7
Net cash provided by operating activities........ 731 498 1,940 (908) 2,261
Cash flows from investing activities:
Purchase of property and equipment and
capitalized software, net...................................... —(324)(552) — (876)
Other, net................................................................. ——13—13
Net cash used by investing activities ............... —(324)(539) — (863)
Cash flows from financing activities:
Debt repaid, net of debt issued................................ —(799)(4) — (803)
Dividends paid ........................................................ (324) — (908) 908 (324)
Common stock acquired, net of
issuance of common stock................................... (1,163) — — — (1,163)
Intercompany activity, net....................................... (194) 642 (448) — —
Other, net................................................................. (45)(14)(40) — (99)
Net cash used by financing activities............... (1,726)(171)(1,400) 908 (2,389)
Net increase (decrease) in cash and cash equivalents.. (995) 3 1 — (991)
Cash and cash equivalents at beginning of period....... 2,533 38 256 — 2,827
Cash and cash equivalents at end of period ................. $ 1,538 $ 41 $ 257 $ — $ 1,836