Macy's 2012 Annual Report Download - page 23
Download and view the complete annual report
Please find page 23 of the 2012 Macy's annual report below. You can navigate through the pages in the report by either clicking on the pages listed below, or by using the keyword search tool below to find specific information within the annual report.-
 1
1 -
2
-
3
-
4
-
5
-
6
-
7
-
8
-
9
-
10
-
11
-
12
-
 13
13 -
 14
14 -
 15
15 -
 16
16 -
 17
17 -
 18
18 -
 19
19 -
 20
20 -
 21
21 -
 22
22 -
 23
23 -
 24
24 -
 25
25 -
 26
26 -
 27
27 -
 28
28 -
 29
29 -
 30
30 -
 31
31 -
 32
32 -
 33
33 -
34
-
35
-
36
-
37
-
38
-
39
-
40
-
41
-
42
-
43
-
44
-
45
-
46
-
47
-
48
-
49
-
50
-
51
-
52
-
53
-
54
-
55
-
56
-
57
-
58
-
59
-
60
-
61
-
62
-
63
-
64
-
65
-
66
-
67
-
68
-
69
-
70
-
71
-
72
-
73
-
74
-
75
-
76
-
77
-
78
-
79
-
80
-
81
-
82
-
83
-
84
-
85
-
86
-
87
-
88
-
89
-
90
-
91
-
92
-
93
-
94
-
95
-
96
-
97
-
98
-
99
-
100
-
101
-
102
-
103
-
104
 |
 |

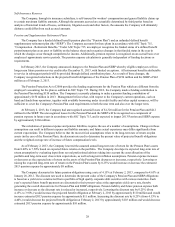
18
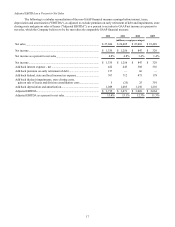
ROIC
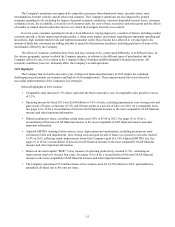
The Company defines ROIC as adjusted operating income as a percent to average invested capital. Average invested
capital is comprised of an annual two-point (i.e., end of the previous year and the immediately preceding year) average of gross
property and equipment, a capitalized value of non-capitalized leases equal to periodic annual reported net rent expense
multiplied by a factor of eight and a four-point (i.e., end of each quarter within the period presented) average of other selected
assets and liabilities.
The following is a tabular reconciliation of the non-GAAP financial measure of ROIC to operating income as a percent to
property and equipment - net, which the Company believes to be the most directly comparable GAAP financial measure.
2012 2011 2010 2009
(millions, except percentages)
Operating income........................................................................................ $ 2,661 $ 2,411 $ 1,894 $ 1,063
Property and equipment - net...................................................................... $ 8,308 $ 8,617 $ 9,160 $ 9,975
Operating income as a percent to property and equipment - net................. 32.0% 28.0% 20.7% 10.7%
Operating income........................................................................................ $ 2,661 $ 2,411 $ 1,894 $ 1,063
Add back (deduct) impairments, store closing costs,
gain on sale of leases and division consolidation costs........................... 5(25) 25 391
Add back depreciation and amortization..................................................... 1,049 1,085 1,150 1,210
Add back rent expense, net
Real estate................................................................................................ 258 243 235 229
Personal property..................................................................................... 11 10 10 12
Deferred rent amortization ...................................................................... 7877
Adjusted operating income ......................................................................... $ 3,991 $ 3,732 $ 3,321 $ 2,912
Property and equipment - net...................................................................... $ 8,308 $ 8,617 $ 9,160 $ 9,975
Add back accumulated depreciation and amortization ............................... 5,967 6,018 5,916 5,620
Add capitalized value of non-capitalized leases ......................................... 2,208 2,088 2,016 1,984
Add (deduct) other selected assets and liabilities:
Receivables.............................................................................................. 322 294 317 305
Merchandise inventories.......................................................................... 5,754 5,596 5,211 5,170
Prepaid expenses and other current assets............................................... 390 409 283 231
Other assets.............................................................................................. 579 528 526 497
Merchandise accounts payable................................................................ (2,362)(2,314)(2,085)(1,978)
Accounts payable and accrued liabilities ................................................ (2,333)(2,309)(2,274)(2,320)
Total average invested capital..................................................................... $ 18,833 $ 18,927 $ 19,070 $ 19,484
ROIC........................................................................................................... 21.2% 19.7% 17.4% 14.9%