Macy's 2012 Annual Report Download - page 21
Download and view the complete annual report
Please find page 21 of the 2012 Macy's annual report below. You can navigate through the pages in the report by either clicking on the pages listed below, or by using the keyword search tool below to find specific information within the annual report.-
 1
1 -
2
-
3
-
4
-
5
-
6
-
7
-
8
-
9
-
10
-
 11
11 -
 12
12 -
 13
13 -
 14
14 -
 15
15 -
 16
16 -
 17
17 -
 18
18 -
 19
19 -
 20
20 -
 21
21 -
 22
22 -
 23
23 -
 24
24 -
 25
25 -
 26
26 -
 27
27 -
 28
28 -
 29
29 -
 30
30 -
 31
31 -
32
-
33
-
34
-
35
-
36
-
37
-
38
-
39
-
40
-
41
-
42
-
43
-
44
-
45
-
46
-
47
-
48
-
49
-
50
-
51
-
52
-
53
-
54
-
55
-
56
-
57
-
58
-
59
-
60
-
61
-
62
-
63
-
64
-
65
-
66
-
67
-
68
-
69
-
70
-
71
-
72
-
73
-
74
-
75
-
76
-
77
-
78
-
79
-
80
-
81
-
82
-
83
-
84
-
85
-
86
-
87
-
88
-
89
-
90
-
91
-
92
-
93
-
94
-
95
-
96
-
97
-
98
-
99
-
100
-
101
-
102
-
103
-
104
 |
 |

16
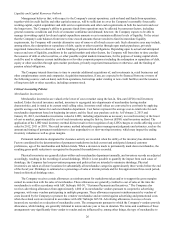
Important Information Regarding Non-GAAP Financial Measures
The Company reports its financial results in accordance with generally accepted accounting principles ("GAAP").
However, management believes that certain non-GAAP financial measures provide users of the Company's financial
information with additional useful information in evaluating operating performance. In particular, management believes that
excluding certain items that may vary substantially in frequency and magnitude from diluted earnings per share and from
operating income and EBITDA as percentages to sales are useful supplemental measures that assist in evaluating the
Company's ability to generate earnings and leverage sales, respectively, and to more readily compare these metrics between
past and future periods. Management also believes that EBITDA and adjusted EBITDA are frequently used by investors and
securities analysts in their evaluations of companies, and that such supplemental measures facilitate comparisons between
companies that have different capital and financing structures and/or tax rates. In addition, management believes that ROIC is a
useful supplemental measure in evaluating how efficiently the Company employs its capital. The Company uses Adjusted
EBITDA as a percent to net sales (with sales excluding certain items for this purpose) and ROIC as performance measures for
certain components of executive compensation.
Non-GAAP financial measures should be viewed as supplementing, and not as an alternative or substitute for, the
Company's financial results prepared in accordance with GAAP. Certain of the items that may be excluded or included in non-
GAAP financial measures may be significant items that could impact the Company's financial position, results of operations
and cash flows and should therefore be considered in assessing the Company's actual financial condition and performance. The
methods used by the Company to calculate its non-GAAP financial measures may differ significantly from methods used by
other companies to compute similar measures. As a result, any non-GAAP financial measures presented herein may not be
comparable to similar measures provided by other companies.
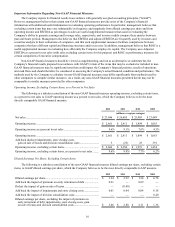
Operating Income, Excluding Certain Items, as a Percent to Net Sales
The following is a tabular reconciliation of the non-GAAP financial measure operating income, excluding certain items,
as a percent to net sales to GAAP operating income as a percent to net sales, which the Company believes to be the most
directly comparable GAAP financial measure.
2012 2011 2010 2009
(millions, except percentages)
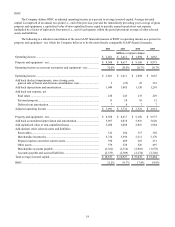
Net sales...................................................................................................... $ 27,686 $ 26,405 $ 25,003 $ 23,489
Operating income........................................................................................ $ 2,661 $ 2,411 $ 1,894 $ 1,063
Operating income as a percent to net sales ................................................. 9.6% 9.1% 7.6% 4.5%
Operating income........................................................................................ $ 2,661 $ 2,411 $ 1,894 $ 1,063
Add back (deduct) impairments, store closing costs,
gain on sale of leases and division consolidation costs........................... 5(25) 25 391
Operating income, excluding certain items................................................. $ 2,666 $ 2,386 $ 1,919 $ 1,454
Operating income, excluding certain items, as a percent to net sales......... 9.6% 9.0% 7.7% 6.2%
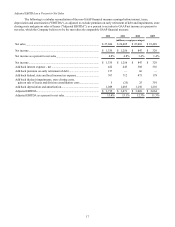
Diluted Earnings Per Share, Excluding Certain Items
The following is a tabular reconciliation of the non-GAAP financial measure diluted earnings per share, excluding certain
items, to GAAP diluted earnings per share, which the Company believes to be the most directly comparable GAAP measure.
2012 2011 2010 2009
Diluted earnings per share........................................................................... $ 3.24 $ 2.92 $ 1.98 $ 0.78
Add back the impact of premium on early retirement of debt.................... 0.21 — 0.09 —
Deduct the impact of gain on sale of leases................................................ —(0.08) — —
Add back the impact of impairments and store closing costs ..................... 0.01 0.04 0.04 0.18
Add back the impact of division consolidation costs.................................. — — — 0.40
Diluted earnings per share, excluding the impact of premium on
early retirement of debt, impairments, store closing costs, gain
on sale of leases and division consolidation costs................................... $ 3.46 $ 2.88 $ 2.11 $ 1.36