Macy's 2012 Annual Report Download - page 74
Download and view the complete annual report
Please find page 74 of the 2012 Macy's annual report below. You can navigate through the pages in the report by either clicking on the pages listed below, or by using the keyword search tool below to find specific information within the annual report.-
 1
1 -
2
-
3
-
4
-
5
-
6
-
7
-
8
-
9
-
10
-
11
-
12
-
13
-
14
-
15
-
16
-
17
-
18
-
19
-
20
-
21
-
22
-
23
-
24
-
25
-
26
-
27
-
28
-
29
-
30
-
31
-
32
-
33
-
34
-
35
-
36
-
37
-
38
-
39
-
40
-
41
-
42
-
43
-
44
-
45
-
46
-
47
-
48
-
49
-
50
-
51
-
52
-
53
-
54
-
55
-
56
-
57
-
58
-
59
-
60
-
61
-
62
-
63
-
 64
64 -
 65
65 -
 66
66 -
 67
67 -
 68
68 -
 69
69 -
 70
70 -
 71
71 -
 72
72 -
 73
73 -
 74
74 -
 75
75 -
 76
76 -
 77
77 -
 78
78 -
 79
79 -
 80
80 -
 81
81 -
 82
82 -
 83
83 -
 84
84 -
85
-
86
-
87
-
88
-
89
-
90
-
91
-
92
-
93
-
94
-
95
-
96
-
97
-
98
-
99
-
100
-
101
-
102
-
103
-
104
 |
 |

NOTES TO CONSOLIDATED FINANCIAL STATEMENTS — (Continued)
F-27
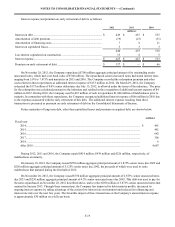
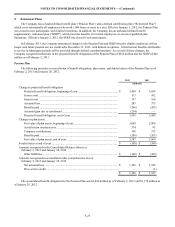
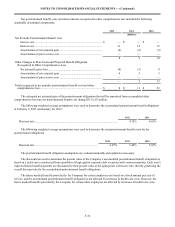
The Company develops its expected long-term rate of return on plan asset assumption by evaluating input from several
professional advisors taking into account the asset allocation of the portfolio and long-term asset class return expectations, as
well as long-term inflation assumptions. Expected returns for each major asset class are considered along with their volatility
and the expected correlations among them. These expectations are based upon historical relationships as well as forecasts of
how future returns may vary from historical returns. Returns by asset class and correlations among asset classes are combined
using the target asset allocation to derive an expected return for the portfolio as a whole. Long-term historical returns of the
portfolio are also considered. Portfolio returns are calculated net of all expenses, therefore, the Company also analyzes expected
costs and expenses, including investment management fees, administrative expenses, Pension Benefit Guaranty Corporation
premiums and other costs and expenses.
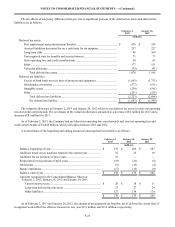
The Company develops its rate of compensation increase assumption on an age-graded basis based on recent experience
and reflects an estimate of future compensation levels taking into account general increase levels, seniority, promotions and
other factors. The salary increase assumption is used to project employees’ pay in future years and its impact on the projected
benefit obligation for the Pension Plan.
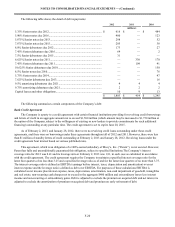
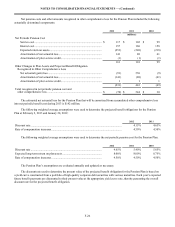
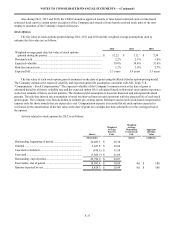
The assets of the Pension Plan are managed by investment specialists with the primary objectives of payment of benefit
obligations to Plan participants and an ultimate realization of investment returns over longer periods in excess of inflation. The
Company employs a total return investment approach whereby a mix of domestic and foreign equity securities, fixed income
securities and other investments is used to maximize the long-term return on the assets of the Pension Plan for a prudent level
of risk. Risks are mitigated through the asset diversification and the use of multiple investment managers. The target allocation
for plan assets is currently 55% equity securities, 30% debt securities, 10% real estate and 5% private equities.
The Company generally employs investment managers to specialize in a specific asset class. These managers are chosen
and monitored with the assistance of professional advisors, using criteria that include organizational structure, investment
philosophy, investment process, performance compared to market benchmarks and peer groups.
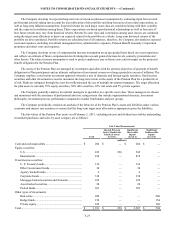
The Company periodically conducts an analysis of the behavior of the Pension Plan’s assets and liabilities under various
economic and interest rate scenarios to ensure that the long-term target asset allocation is appropriate given the liabilities.
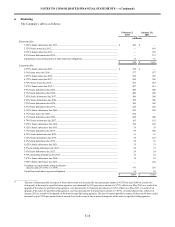
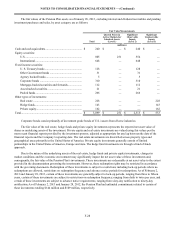
The fair values of the Pension Plan assets as of February 2, 2013, excluding interest and dividend receivables and pending
investment purchases and sales, by asset category are as follows:
Fair Value Measurements
Total
Quoted Prices in
Active Markets for
Identical Assets
(Level 1)
Significant
Observable
Inputs
(Level 2)
Significant
Unobservable
Inputs
(Level 3)
(millions)
Cash and cash equivalents................................................... $ 204 $ — $ 204 $ —
Equity securities:
U.S. ............................................................................... 832 290 542 —
International ................................................................. 818 — 818 —
Fixed income securities:
U. S. Treasury bonds.................................................... 136 — 136 —
Other Government bonds ............................................. 34 — 34 —
Agency backed bonds................................................... 6 — 6 —
Corporate bonds ........................................................... 338 — 338 —
Mortgage-backed securities and forwards.................... 102 — 102 —
Asset-backed securities ................................................ 24 — 24 —
Pooled funds................................................................. 303 — 303 —
Other types of investments:
Real estate .................................................................... 280 — — 280
Hedge funds.................................................................. 154 — — 154
Private equity................................................................ 160 — — 160
Total..................................................................................... $ 3,391 $ 290 $ 2,507 $ 594