Macy's 2012 Annual Report Download - page 25
Download and view the complete annual report
Please find page 25 of the 2012 Macy's annual report below. You can navigate through the pages in the report by either clicking on the pages listed below, or by using the keyword search tool below to find specific information within the annual report.-
 1
1 -
2
-
3
-
4
-
5
-
6
-
7
-
8
-
9
-
10
-
11
-
12
-
13
-
14
-
 15
15 -
 16
16 -
 17
17 -
 18
18 -
 19
19 -
 20
20 -
 21
21 -
 22
22 -
 23
23 -
 24
24 -
 25
25 -
 26
26 -
 27
27 -
 28
28 -
 29
29 -
 30
30 -
 31
31 -
 32
32 -
 33
33 -
 34
34 -
 35
35 -
36
-
37
-
38
-
39
-
40
-
41
-
42
-
43
-
44
-
45
-
46
-
47
-
48
-
49
-
50
-
51
-
52
-
53
-
54
-
55
-
56
-
57
-
58
-
59
-
60
-
61
-
62
-
63
-
64
-
65
-
66
-
67
-
68
-
69
-
70
-
71
-
72
-
73
-
74
-
75
-
76
-
77
-
78
-
79
-
80
-
81
-
82
-
83
-
84
-
85
-
86
-
87
-
88
-
89
-
90
-
91
-
92
-
93
-
94
-
95
-
96
-
97
-
98
-
99
-
100
-
101
-
102
-
103
-
104
 |
 |

20
Comparison of 2012 and 2011
Net Income
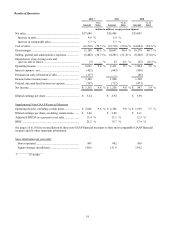
Net income for 2012 increased compared to 2011, reflecting the benefits of the key strategies at Macy's, the continued
strong performance at Bloomingdale's, higher income from credit operations, and the 53rd week in 2012.
Net Sales
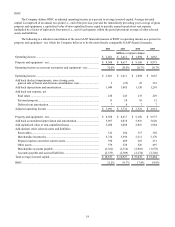
Net sales for 2012 increased $1,281 million or 4.9% compared to 2011. On a comparable basis, net sales for 2012 were
up 3.7% compared to 2011. Sales from the Company's Internet businesses in 2012 increased 41.0% on a comparable basis to
2011 and positively affected the Company's 2012 comparable sales by 2.2%. The Company continues to benefit from the
successful execution of the My Macy's localization, Omnichannel and MAGIC Selling strategies. Geographically, sales in 2012
were strongest in the southern regions as well as some markets in other parts of the country such as Western New York, Oregon
and Colorado. By family of business, sales in 2012 were strongest in watches, handbags, cosmetics, textiles, furniture and
mattresses. Sales of the Company's private label brands continued to be strong with particular growth coming from millennial,
classic apparel and home textile brands. Sales of the Company's private label brands represented approximately 20% of net
sales in the Macy's-branded stores in 2012. Sales in 2012 were less strong in juniors. The Company calculates comparable sales
as sales from stores in operation throughout 2011 and 2012 and all net Internet sales, adjusting for the 53rd week in 2012.
Stores undergoing remodeling, expansion or relocation remain in the comparable sales calculation unless the store is closed for
a significant period of time. Definitions and calculations of comparable sales differ among companies in the retail industry.
Cost of Sales
Cost of sales for 2012 increased $800 million from 2011. The cost of sales rate as a percent to net sales was higher in
2012, as compared to 2011, primarily due to growth of the omnichannel businesses and the resulting impact of free shipping.
The application of the last-in, first-out (LIFO) retail inventory method did not result in the recognition of any LIFO charges or
credits affecting cost of sales in either period.
Selling, General and Administrative Expenses
Selling, general and administrative (“SG&A”) expenses for 2012 increased $201 million from 2011. The SG&A rate as a
percent to net sales was 70 basis points lower in 2012, as compared to 2011, reflecting increased net sales. SG&A expenses in
2012 were impacted by higher selling costs as a result of stronger sales, higher retirement expenses (including Pension Plan,
SERP and 401(k) expenses), and greater investments in the Company's omnichannel operations, partially offset by higher
income from credit operations and lower depreciation and amortization expense. Retirement expenses were $232 million in
2012 as compared to $160 million in 2011, primarily due to the lower discount rate. Advertising expense, net of cooperative
advertising allowances, was $1,181 million for 2012 compared to $1,136 million for 2011. Advertising expense, net of
cooperative advertising allowances, as a percent to net sales was 4.3% for both 2012 and 2011. Income from credit operations
was $663 million in 2012 as compared to $582 million in 2011. Depreciation and amortization expense was $1,049 million for
2012, compared to $1,085 million for 2011.
Impairments, Store Closing Costs and Gain on Sale of Leases
Impairments, store closing costs and gain on sale of leases for 2012 includes $4 million of asset impairment charges
primarily related to the store closings announced in January 2013 and $1 million of other costs and expenses primarily related
to the announced store closings. Impairments, store closing costs and gain on sale of leases for 2011 included a $54 million
gain from the sale of store leases related to the 2006 divestiture of Lord & Taylor, partially offset by $22 million of asset
impairment charges primarily related to the store closings announced in January 2012 and $7 million of other costs and
expenses primarily related to the announced store closings.
Net Interest Expense
Net interest expense for 2012 decreased $21 million from 2011. Net interest expense for 2012 benefited from lower
levels of borrowings and lower rates on outstanding borrowings as compared to 2011.