Macy's 2012 Annual Report Download - page 20
Download and view the complete annual report
Please find page 20 of the 2012 Macy's annual report below. You can navigate through the pages in the report by either clicking on the pages listed below, or by using the keyword search tool below to find specific information within the annual report.-
 1
1 -
2
-
3
-
4
-
5
-
6
-
7
-
8
-
9
-
 10
10 -
 11
11 -
 12
12 -
 13
13 -
 14
14 -
 15
15 -
 16
16 -
 17
17 -
 18
18 -
 19
19 -
 20
20 -
 21
21 -
 22
22 -
 23
23 -
 24
24 -
 25
25 -
 26
26 -
 27
27 -
 28
28 -
 29
29 -
 30
30 -
31
-
32
-
33
-
34
-
35
-
36
-
37
-
38
-
39
-
40
-
41
-
42
-
43
-
44
-
45
-
46
-
47
-
48
-
49
-
50
-
51
-
52
-
53
-
54
-
55
-
56
-
57
-
58
-
59
-
60
-
61
-
62
-
63
-
64
-
65
-
66
-
67
-
68
-
69
-
70
-
71
-
72
-
73
-
74
-
75
-
76
-
77
-
78
-
79
-
80
-
81
-
82
-
83
-
84
-
85
-
86
-
87
-
88
-
89
-
90
-
91
-
92
-
93
-
94
-
95
-
96
-
97
-
98
-
99
-
100
-
101
-
102
-
103
-
104
 |
 |
15
The Company's operations are impacted by competitive pressures from department stores, specialty stores, mass
merchandisers, Internet websites and all other retail channels. The Company's operations are also impacted by general
consumer spending levels, including the impact of general economic conditions, consumer disposable income levels, consumer
confidence levels, the availability, cost and level of consumer debt, the costs of basic necessities and other goods and the effects
of weather or natural disasters and other factors over which the Company has little or no control.
In recent years, consumer spending levels have been affected to varying degrees by a number of factors, including modest
economic growth, a slowly improving housing market, a rising stock market, uncertainty regarding governmental spending and
tax policies, high unemployment levels and tightened consumer credit. These factors have affected to varying degrees the
amount of funds that consumers are willing and able to spend for discretionary purchases, including purchases of some of the
merchandise offered by the Company.
The effects of economic conditions have been, and may continue to be, experienced differently, or at different times, in
the various geographic regions in which the Company operates, in relation to the different types of merchandise that the
Company offers for sale, or in relation to the Company's Macy's-branded and Bloomingdale's-branded operations. All
economic conditions, however, ultimately affect the Company's overall operations.
2012 Highlights
The Company had its fourth consecutive year of improved financial performance in 2012 despite the continued
challenging macroeconomic environment and high level of unemployment. These improvements have been driven by
successful implementation of the Company's key strategies.
Selected highlights of 2012 include:
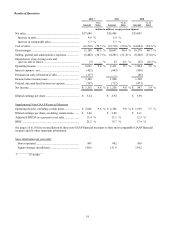
• Comparable sales increased 3.7% which represents the third consecutive year of comparable sales growth in excess
of 3.5%.
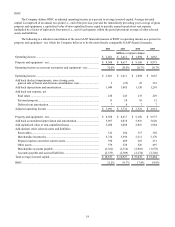
• Operating income for fiscal 2012 was $2.666 billion or 9.6% of sales, excluding impairments, store closing costs and
gain on sale of leases, an increase of 12% and 60 basis points as a percent of sales over 2011 on a comparable basis.
See pages 16 to 18 for a reconciliation of this non-GAAP financial measure to the most comparable GAAP financial
measure and other important information.
• Diluted earnings per share, excluding certain items, grew 20% to $3.46 in 2012. See pages 16 to 18 for a
reconciliation of this non-GAAP financial measure to the most comparable GAAP financial measure and other
important information.
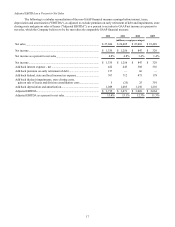
• Adjusted EBITDA (earnings before interest, taxes, depreciation and amortization, excluding premium on early
retirement of debt and impairments, store closing costs and gain on sale of leases) as a percent to net sales reached
13.4% in 2012, reflecting steady improvement toward the Company's goal of a 14% Adjusted EBITDA rate. See
pages 16 to 18 for a reconciliation of this non-GAAP financial measure to the most comparable GAAP financial
measure and other important information.
• Return on invested capital ("ROIC") a key measure of operating productivity, reached 21.2%, continuing an
improvement trend over the past four years. See pages 16 to 18 for a reconciliation of this non-GAAP financial
measure to the most comparable GAAP financial measure and other important information.
• The Company repurchased 35.6 million shares of its common stock for $1,350 million in 2012, and doubled its
annualized dividend rate to 80 cents per share.