Macy's 2012 Annual Report Download - page 24
Download and view the complete annual report
Please find page 24 of the 2012 Macy's annual report below. You can navigate through the pages in the report by either clicking on the pages listed below, or by using the keyword search tool below to find specific information within the annual report.-
 1
1 -
2
-
3
-
4
-
5
-
6
-
7
-
8
-
9
-
10
-
11
-
12
-
13
-
 14
14 -
 15
15 -
 16
16 -
 17
17 -
 18
18 -
 19
19 -
 20
20 -
 21
21 -
 22
22 -
 23
23 -
 24
24 -
 25
25 -
 26
26 -
 27
27 -
 28
28 -
 29
29 -
 30
30 -
 31
31 -
 32
32 -
 33
33 -
 34
34 -
35
-
36
-
37
-
38
-
39
-
40
-
41
-
42
-
43
-
44
-
45
-
46
-
47
-
48
-
49
-
50
-
51
-
52
-
53
-
54
-
55
-
56
-
57
-
58
-
59
-
60
-
61
-
62
-
63
-
64
-
65
-
66
-
67
-
68
-
69
-
70
-
71
-
72
-
73
-
74
-
75
-
76
-
77
-
78
-
79
-
80
-
81
-
82
-
83
-
84
-
85
-
86
-
87
-
88
-
89
-
90
-
91
-
92
-
93
-
94
-
95
-
96
-
97
-
98
-
99
-
100
-
101
-
102
-
103
-
104
 |
 |

19
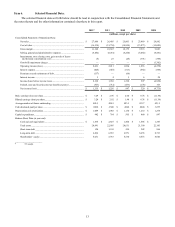
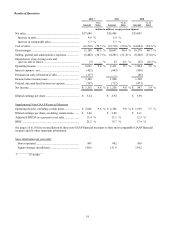
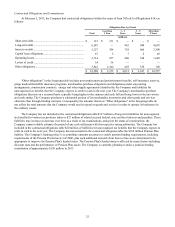
Results of Operations
2012 * 2011 2010
Amount % to
Sales Amount % to
Sales Amount % to
Sales
(dollars in millions, except per share figures)
Net sales........................................................................... $27,686 $26,405 $25,003
Increase in sales ........................................................... 4.9 % 5.6 %
Increase in comparable sales........................................ 3.7 % 5.3 %
Cost of sales..................................................................... (16,538)(59.7) % (15,738)(59.6) % (14,824)(59.3) %
Gross margin.................................................................... 11,148 40.3 % 10,667 40.4 % 10,179 40.7 %
Selling, general and administrative expenses.................. (8,482)(30.7) % (8,281)(31.4) % (8,260)(33.0) %
Impairments, store closing costs and
gain on sale of leases................................................... (5) — % 25 0.1 % (25)(0.1) %
Operating income ............................................................ 2,661 9.6 % 2,411 9.1 % 1,894 7.6 %
Interest expense - net....................................................... (422)(443)(508)
Premium on early retirement of debt............................... (137) — (66)
Income before income taxes............................................ 2,102 1,968 1,320
Federal, state and local income tax expense.................... (767)(712)(473)
Net income....................................................................... $ 1,335 4.8 % $ 1,256 4.8 % $ 847 3.4 %
Diluted earnings per share............................................... $ 3.24 $ 2.92 $ 1.98
Supplemental Non-GAAP Financial Measures
Operating income, excluding certain items..................... $ 2,666 9.6 % $ 2,386 9.0 % $ 1,919 7.7 %
Diluted earnings per share, excluding certain items........ $ 3.46 $ 2.88 $ 2.11
Adjusted EBITDA as a percent to net sales..................... 13.4 % 13.1 % 12.3 %
ROIC................................................................................ 21.2 % 19.7 % 17.4 %
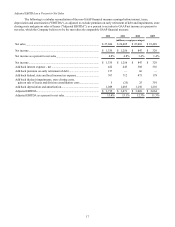
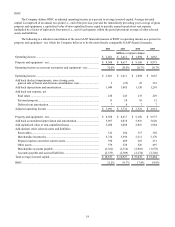
See pages 16 to 18 for a reconciliation of these non-GAAP financial measures to their most comparable GAAP financial
measure and for other important information.
Store information (at year-end):
Stores operated............................................................. 841 842 850
Square footage (in millions)......................................... 150.6 151.9 154.2
___________________
* 53 weeks