Macy's 2012 Annual Report Download - page 18
Download and view the complete annual report
Please find page 18 of the 2012 Macy's annual report below. You can navigate through the pages in the report by either clicking on the pages listed below, or by using the keyword search tool below to find specific information within the annual report.-
 1
1 -
2
-
3
-
4
-
5
-
6
-
7
-
 8
8 -
 9
9 -
 10
10 -
 11
11 -
 12
12 -
 13
13 -
 14
14 -
 15
15 -
 16
16 -
 17
17 -
 18
18 -
 19
19 -
 20
20 -
 21
21 -
 22
22 -
 23
23 -
 24
24 -
 25
25 -
 26
26 -
 27
27 -
 28
28 -
29
-
30
-
31
-
32
-
33
-
34
-
35
-
36
-
37
-
38
-
39
-
40
-
41
-
42
-
43
-
44
-
45
-
46
-
47
-
48
-
49
-
50
-
51
-
52
-
53
-
54
-
55
-
56
-
57
-
58
-
59
-
60
-
61
-
62
-
63
-
64
-
65
-
66
-
67
-
68
-
69
-
70
-
71
-
72
-
73
-
74
-
75
-
76
-
77
-
78
-
79
-
80
-
81
-
82
-
83
-
84
-
85
-
86
-
87
-
88
-
89
-
90
-
91
-
92
-
93
-
94
-
95
-
96
-
97
-
98
-
99
-
100
-
101
-
102
-
103
-
104
 |
 |

13
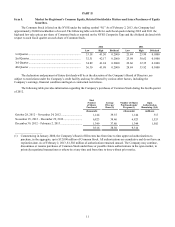
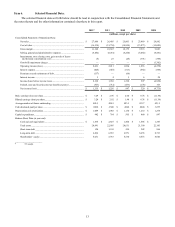
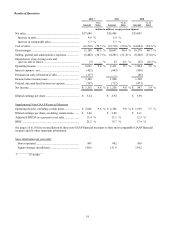
Item 6. Selected Financial Data.
The selected financial data set forth below should be read in conjunction with the Consolidated Financial Statements and
the notes thereto and the other information contained elsewhere in this report.
2012* 2011 2010 2009 2008
(millions, except per share)
Consolidated Statement of Operations Data:
Net sales................................................................................................ $ 27,686 $ 26,405 $ 25,003 $ 23,489 $ 24,892
Cost of sales.......................................................................................... (16,538) (15,738) (14,824) (13,973) (15,009)
Gross margin......................................................................................... 11,148 10,667 10,179 9,516 9,883
Selling, general and administrative expenses ....................................... (8,482) (8,281) (8,260) (8,062) (8,481)
Impairments, store closing costs, gain on sale of leases
and division consolidation costs ........................................................ (5) 25 (25) (391) (398)
Goodwill impairment charges............................................................... — — — — (5,382)
Operating income (loss)........................................................................ 2,661 2,411 1,894 1,063 (4,378)
Interest expense..................................................................................... (425) (447) (513) (562) (588)
Premium on early retirement of debt .................................................... (137) — (66) — —
Interest income...................................................................................... 3 4 5 6 28
Income (loss) before income taxes ....................................................... 2,102 1,968 1,320 507 (4,938)
Federal, state and local income tax benefit (expense) .......................... (767) (712) (473) (178) 163
Net income (loss).................................................................................. $ 1,335 $ 1,256 $ 847 $ 329 $ (4,775)
Basic earnings (loss) per share....................................................................... $ 3.29 $ 2.96 $ 2.00 $ 0.78 $ (11.34)
Diluted earnings (loss) per share.................................................................... $ 3.24 $ 2.92 $ 1.98 $ 0.78 $ (11.34)
Average number of shares outstanding.......................................................... 405.5 424.5 423.3 421.7 421.2
Cash dividends paid per share........................................................................ $ .8000 $ .3500 $ .2000 $ .2000 $ .5275
Depreciation and amortization....................................................................... $ 1,049 $ 1,085 $ 1,150 $ 1,210 $ 1,278
Capital expenditures....................................................................................... $ 942 $ 764 $ 505 $ 460 $ 897
Balance Sheet Data (at year end):
Cash and cash equivalents .................................................................... $ 1,836 $ 2,827 $ 1,464 $ 1,686 $ 1,385
Total assets............................................................................................ 20,991 22,095 20,631 21,300 22,145
Short-term debt ..................................................................................... 124 1,103 454 242 966
Long-term debt...................................................................................... 6,806 6,655 6,971 8,456 8,733
Shareholders’ equity.............................................................................. 6,051 5,933 5,530 4,653 4,620
___________________
* 53 weeks