Macy's 2012 Annual Report Download - page 16
Download and view the complete annual report
Please find page 16 of the 2012 Macy's annual report below. You can navigate through the pages in the report by either clicking on the pages listed below, or by using the keyword search tool below to find specific information within the annual report.-
 1
1 -
2
-
3
-
4
-
5
-
 6
6 -
 7
7 -
 8
8 -
 9
9 -
 10
10 -
 11
11 -
 12
12 -
 13
13 -
 14
14 -
 15
15 -
 16
16 -
 17
17 -
 18
18 -
 19
19 -
 20
20 -
 21
21 -
 22
22 -
 23
23 -
 24
24 -
 25
25 -
 26
26 -
27
-
28
-
29
-
30
-
31
-
32
-
33
-
34
-
35
-
36
-
37
-
38
-
39
-
40
-
41
-
42
-
43
-
44
-
45
-
46
-
47
-
48
-
49
-
50
-
51
-
52
-
53
-
54
-
55
-
56
-
57
-
58
-
59
-
60
-
61
-
62
-
63
-
64
-
65
-
66
-
67
-
68
-
69
-
70
-
71
-
72
-
73
-
74
-
75
-
76
-
77
-
78
-
79
-
80
-
81
-
82
-
83
-
84
-
85
-
86
-
87
-
88
-
89
-
90
-
91
-
92
-
93
-
94
-
95
-
96
-
97
-
98
-
99
-
100
-
101
-
102
-
103
-
104
 |
 |

11
PART II
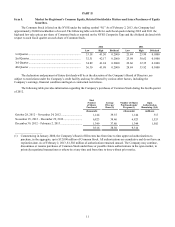
Item 5. Market for Registrant’s Common Equity, Related Stockholder Matters and Issuer Purchases of Equity
Securities.
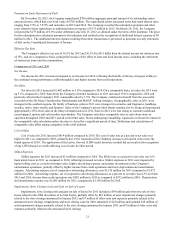
The Common Stock is listed on the NYSE under the trading symbol “M.” As of February 2, 2013, the Company had
approximately 20,000 stockholders of record. The following table sets forth for each fiscal quarter during 2012 and 2011 the
high and low sales prices per share of Common Stock as reported on the NYSE Composite Tape and the dividend declared with
respect to each fiscal quarter on each share of Common Stock.
2012 2011
Low High Dividend Low High Dividend
1st Quarter......................................................................... 33.18 41.50 0.2000 21.69 25.99 0.0500
2nd Quarter ....................................................................... 32.31 42.17 0.2000 23.98 30.62 0.1000
3rd Quarter........................................................................ 34.89 41.24 0.2000 22.66 32.35 0.1000
4th Quarter ........................................................................ 36.30 41.98 0.2000 28.69 35.92 0.1000
The declaration and payment of future dividends will be at the discretion of the Company’s Board of Directors, are
subject to restrictions under the Company’s credit facility and may be affected by various other factors, including the
Company’s earnings, financial condition and legal or contractual restrictions.
The following table provides information regarding the Company’s purchases of Common Stock during the fourth quarter
of 2012.
Total
Number
of Shares
Purchased
Average
Price per
Share ($)
Number of Shares
Purchased under
Program (1)
Open
Authorization
Remaining (1)($)
(thousands) (thousands) (millions)
October 28, 2012 – November 24, 2012 ............................. 1,144 39.55 1,144 315
November 25, 2012 – December 29, 2012.......................... 6,823 38.46 6,823 1,553
December 30, 2012 – February 2, 2013 .............................. 1,349 37.80 1,349 1,502
9,316 38.50 9,316
___________________
(1) Commencing in January 2000, the Company’s Board of Directors has from time to time approved authorizations to
purchase, in the aggregate, up to $12,000 million of Common Stock. All authorizations are cumulative and do not have an
expiration date. As of February 2, 2013, $1,502 million of authorization remained unused. The Company may continue,
discontinue or resume purchases of Common Stock under these or possible future authorizations in the open market, in
privately negotiated transactions or otherwise at any time and from time to time without prior notice.