Lumber Liquidators 2014 Annual Report Download - page 74
Download and view the complete annual report
Please find page 74 of the 2014 Lumber Liquidators annual report below. You can navigate through the pages in the report by either clicking on the pages listed below, or by using the keyword search tool below to find specific information within the annual report.-
 1
1 -
2
-
3
-
4
-
5
-
6
-
7
-
8
-
9
-
10
-
11
-
12
-
13
-
14
-
15
-
16
-
17
-
18
-
19
-
20
-
21
-
22
-
23
-
24
-
25
-
26
-
27
-
28
-
29
-
30
-
31
-
32
-
33
-
34
-
35
-
36
-
37
-
38
-
39
-
40
-
41
-
42
-
43
-
44
-
45
-
46
-
47
-
48
-
49
-
50
-
51
-
52
-
53
-
54
-
55
-
56
-
57
-
58
-
59
-
60
-
61
-
62
-
63
-
 64
64 -
 65
65 -
 66
66 -
 67
67 -
 68
68 -
 69
69 -
 70
70 -
 71
71 -
 72
72 -
 73
73 -
 74
74 -
 75
75 -
 76
76 -
 77
77 -
 78
78 -
 79
79 -
 80
80 -
 81
81 -
 82
82 -
 83
83 -
 84
84
 |
 |

Lumber Liquidators Holdings, Inc.
Notes to Consolidated Financial Statements
(amounts in thousands, except share data and per share amounts)
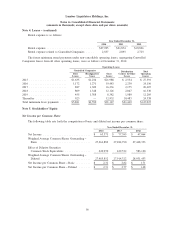
Note 10. Commitments and Contingencies − (continued)
planned to be finalized in May 2015. If these rates are confirmed, the Company would owe approximately
$5,700 for shipments during the applicable time periods. If these rates remain in effect for shipments
subsequent to November 2013 (AD) and shipments subsequent to December 2012 (CVD), the Company
would owe an additional $6,300 for all shipments through December 31, 2014. As this is a preliminary rate,
the Company has not recorded an accrual in its consolidated financial statements for the impact of higher rates
for the applicable time periods covered in the second annual review.
Based on the information available, the Company believes there is at least a reasonable possibility that an
additional loss may have been incurred in the range of $0 to $12,700.
The third annual review of the AD and CVD rates has been initiated in February 2015, with preliminary
rates expected in late 2015 or early 2016. Any change in the applicable rates as a result of the third annual
review would apply to imports occurring after the second period of review.
Other Matters
The Company is also, from time to time, subject to claims and disputes arising in the normal course of
business. In the opinion of management, while the outcome of any such claims and disputes cannot be
predicted with certainty, the Company’s ultimate liability in connection with these matters is not expected to
have a material adverse effect on the results of operations, financial position or cash flows.
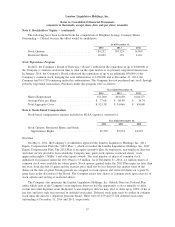
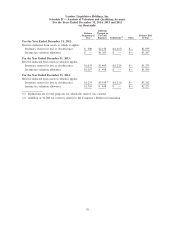
Note 11. Condensed Quarterly Financial Information (unaudited)
The following tables present the Company’s unaudited quarterly results for 2014 and 2013.
Quarter Ended
March 31,
2014
June 30,
2014
September 30,
2014
December 31,
2014
Net Sales ........................... $246,291 $263,085 $266,067 $271,976
Gross Profit ......................... 101,287 106,238 104,158 106,484
Selling, General and Administrative Expenses . . 78,866 79,066 78,377 77,805
Operating Income ..................... 22,421 27,172 25,781 28,679
Net Income ......................... $ 13,694 $ 16,607 $ 15,725 $ 17,345
Net Income per Common Share − Basic ...... $ 0.50 $ 0.61 $ 0.58 $ 0.64
Net Income per Common Share − Diluted ..... $ 0.49 $ 0.60 $ 0.58 $ 0.64
Number of Stores Opened in Quarter ........ 13 13 5 3
Comparable Store Net Sales Decrease ....... (0.6)% (7.1)% (4.9)% (4.2)%
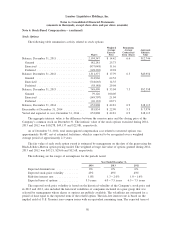
Quarter Ended
March 31,
2013
June 30,
2013
September 30,
2013
December 31,
2013
Net Sales ........................... $230,418 $257,111 $254,278 $258,433
Gross Profit ......................... 92,997 106,079 106,375 105,531
Selling, General and Administrative Expenses . . 67,589 72,992 73,109 71,270
Operating Income ..................... 25,408 33,087 33,266 34,262
Net Income ......................... $ 15,781 $ 20,422 $ 20,397 $ 20,795
Net Income per Common Share − Basic ...... $ 0.58 $ 0.74 $ 0.74 $ 0.75
Net Income per Common Share − Diluted ..... $ 0.57 $ 0.73 $ 0.73 $ 0.74
Number of Stores Opened in Quarter ........ 5 7 7 11
Comparable Store Net Sales Increase ........ 15.2% 14.9% 17.4% 15.6%
66