Lumber Liquidators 2014 Annual Report Download - page 38
Download and view the complete annual report
Please find page 38 of the 2014 Lumber Liquidators annual report below. You can navigate through the pages in the report by either clicking on the pages listed below, or by using the keyword search tool below to find specific information within the annual report.-
 1
1 -
2
-
3
-
4
-
5
-
6
-
7
-
8
-
9
-
10
-
11
-
12
-
13
-
14
-
15
-
16
-
17
-
18
-
19
-
20
-
21
-
22
-
23
-
24
-
25
-
26
-
27
-
 28
28 -
 29
29 -
 30
30 -
 31
31 -
 32
32 -
 33
33 -
 34
34 -
 35
35 -
 36
36 -
 37
37 -
 38
38 -
 39
39 -
 40
40 -
 41
41 -
 42
42 -
 43
43 -
 44
44 -
 45
45 -
 46
46 -
 47
47 -
 48
48 -
49
-
50
-
51
-
52
-
53
-
54
-
55
-
56
-
57
-
58
-
59
-
60
-
61
-
62
-
63
-
64
-
65
-
66
-
67
-
68
-
69
-
70
-
71
-
72
-
73
-
74
-
75
-
76
-
77
-
78
-
79
-
80
-
81
-
82
-
83
-
84
 |
 |

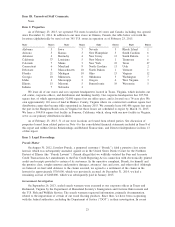
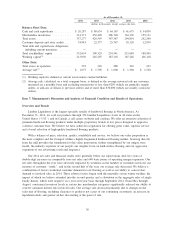
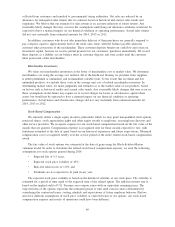
As of December 31,
2014 2013 2012 2011 2010
(dollars in thousands, except average sale data)
Balance Sheet Data
Cash and cash equivalents .......... $ 20,287 $ 80,634 $ 64,167 $ 61,675 $ 34,830
Merchandise inventories ........... 314,371 252,428 206,704 164,139 155,131
Total assets .................... 357,277 429,559 347,387 294,854 242,290
Customer deposits and store credits .... 34,943 22,377 25,747 18,120 12,039
Total debt and capital lease obligations,
including current maturities ....... ———— —
Total stockholders’ equity .......... 332,054 309,329 234,541 215,084 180,505
Working capital
(1)
................ 213,030 245,207 187,118 167,248 146,118
Other Data
Total stores in operation ........... 352 318 288 263 223
Average sale
(2)
.................. $ 1,675 $ 1,705 $ 1,600 $ 1,560 $ 1,520
(1) Working capital is defined as current assets minus current liabilities.
(2) Average sale, calculated on a total company basis, is defined as the average invoiced sale per customer,
measured on a monthly basis and excluding transactions of less than $250 (which are generally sample
orders, or add-ons or fill-ins to previous orders) and of more than $30,000 (which are usually contractor
orders).
Item 7. Management’s Discussion and Analysis of Financial Condition and Results of Operations.
Overview and Trends
Lumber Liquidators is the largest specialty retailer of hardwood flooring in North America. At
December 31, 2014, we sold our products through 352 Lumber Liquidators stores in 46 states in the
United States (‘‘U.S.’’) and in Canada, a call center, websites and catalogs. We offer an extensive selection of
premium hardwood flooring products under multiple proprietary brands at low prices designed to appeal to
a diverse customer base. We believe we have achieved a reputation for offering great value, superior service
and a broad selection of high-quality hardwood flooring products.
With a balance of price, selection, quality, availability and service, we believe our value proposition is
the most complete and the strongest within a highly-fragmented hardwood flooring market. Sourcing directly
from the mill provides the foundation for this value proposition, further strengthened by our unique store
model, the industry expertise of our people, our singular focus on hard-surface flooring and our aggressive
expansion of our advertising reach and frequency.
Our 2014 net sales and financial results were generally below our expectations after two years of
double-digit increases in comparable store net sales and 640 basis points of operating margin expansion. Our
net sales throughout the year were adversely impacted by weakness in the number of customers invoiced, our
measure of customer ‘‘traffic’’, and in the second half of the year, our average sale decreased. We believe a
combination of factors weakened customer demand for our flooring as well as our ability to convert that
demand to invoiced sales in 2014. These adverse factors began with the unusually severe winter weather, the
impact of which we believe extended into the second quarter, and a slowdown in the aggregate sales of single
family homes, which were negative on a year-over-year basis through September 2014. From May through
August, constrained inventory levels in certain key merchandise categories significantly reduced our ability to
convert consumer interest into invoiced sales. Our average sale decreased primarily due to changes in the
sales mix of flooring, including clearance of products not a part of our continuing assortment, an increase in
liquidation deals and greater ad-hoc discounting at the point of sale.
30