Lumber Liquidators 2014 Annual Report Download - page 40
Download and view the complete annual report
Please find page 40 of the 2014 Lumber Liquidators annual report below. You can navigate through the pages in the report by either clicking on the pages listed below, or by using the keyword search tool below to find specific information within the annual report.-
 1
1 -
2
-
3
-
4
-
5
-
6
-
7
-
8
-
9
-
10
-
11
-
12
-
13
-
14
-
15
-
16
-
17
-
18
-
19
-
20
-
21
-
22
-
23
-
24
-
25
-
26
-
27
-
28
-
29
-
 30
30 -
 31
31 -
 32
32 -
 33
33 -
 34
34 -
 35
35 -
 36
36 -
 37
37 -
 38
38 -
 39
39 -
 40
40 -
 41
41 -
 42
42 -
 43
43 -
 44
44 -
 45
45 -
 46
46 -
 47
47 -
 48
48 -
 49
49 -
 50
50 -
51
-
52
-
53
-
54
-
55
-
56
-
57
-
58
-
59
-
60
-
61
-
62
-
63
-
64
-
65
-
66
-
67
-
68
-
69
-
70
-
71
-
72
-
73
-
74
-
75
-
76
-
77
-
78
-
79
-
80
-
81
-
82
-
83
-
84
 |
 |

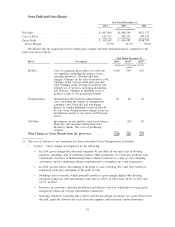
offset by a lower average sale. We expect moderate improvement in the marketplace for residential wood
flooring, marked by periods of volatility when our customer may be cautious and price sensitive. We expect
an increase in unit flow, primarily measured in square feet of flooring, greater than our net sales increase due
to both projected changes in our sales mix and a lower average retail price per unit received from our
customers. We plan to open 30 to 35 new store locations, remodel 15 to 20 existing stores and increase the
number of stores where we provide installation services to approximately 150 by the end of 2015. Though our
gross margin will be pressured by additional sales mix of installation services, we expect those services to be
accretive to operating margin.
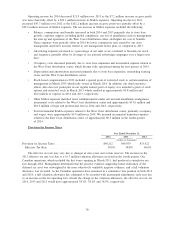
We expect full year 2015 gross margin to be pressured in comparison to 2014, with gross margin in the
second half of the year generally stronger than the first half. Gross margin pressures are expected to be caused
by lower average selling prices due to net changes in retail pricing and modifications in our promotional plan,
net shifts in our sales mix and greater transportation costs due to higher unit flow, partially offset by higher
attachment of moldings and accessories, a reduction in ad-hoc discounting at the point of sale, efficiencies due
to supply chain optimization and generally lower transportation rates.
Net SG&A expenses are expected to increase over 2014 due to store base expansion, transition and full
implementation of our East Coast distribution operations, legal and professional fees which continue at
elevated levels, higher incentive compensation and greater depreciation including recent infrastructure
investments. In the first quarter of 2015, we expect approximately $2.7 million of incremental costs to
transition and fully implement the expanded East Coast distribution operations, including $1.5 million in
transportation costs.
Other External Factors Impacting Our Business
Antidumping and Countervailing Duties Investigation. As discussed in Section 3 — Legal Proceedings,
we are subject to antidumping and countervailing duties on imports of engineered hardwood from China. If
the outcome of ongoing litigation with the United States Department of Commerce and the United States
International Trade Commission is adverse, our results of operations may be materially adversely impacted.
Additionally, the outcome may impact from where we source our engineered hardwood in the future. We
currently source a portion of our engineered hardwood from locations outside of China, and we have the
ability to increase our purchases from these suppliers if the need arises, although at a potentially higher cost
of product than our current engineered hardwood cost. Additionally, we are expanding our assortment of
engineered hardwood which we believe is constructed in such a way as to not be subject to antidumping and
countervailing duties.
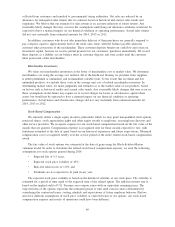
Results of Operations
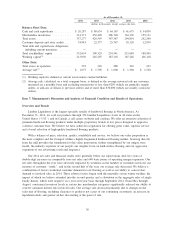
Net Sales
Year Ended December 31,
2014 2013 2012
(dollars in thousands)
Net sales ..................................... $1,047,419 $1,000,240 $813,327
Percentage increase ............................. 4.7% 23.0% 19.3%
Number of stores open at end of period ................ 352 318 288
Number of stores opened in period .................... 34 30 25
percentage increase (decrease)
Average sale ................................... (1.8)% 6.6% 2.5%
Average retail price per unit sold
(1)
.................... (1.9)% 5.7% 0.2%
Comparable stores:
Net sales .................................... (4.3)% 15.8% 11.4%
Customers invoiced ............................ (2.5)% 9.2% 8.9%
Net sales of stores operating for 13 to 36 months ........ 4.2% 21.8% 23.3%
Net sales of stores operating for more than 36 months ..... (5.1)% 14.9% 9.1%
Net sales in markets with all stores comparable (no
cannibalization) ............................... (0.3)% 18.2% 13.3%
Net sales in cannibalized markets
(2)
................... 17.2% 45.2% 33.3%
32