Lumber Liquidators 2014 Annual Report Download - page 46
Download and view the complete annual report
Please find page 46 of the 2014 Lumber Liquidators annual report below. You can navigate through the pages in the report by either clicking on the pages listed below, or by using the keyword search tool below to find specific information within the annual report.-
 1
1 -
2
-
3
-
4
-
5
-
6
-
7
-
8
-
9
-
10
-
11
-
12
-
13
-
14
-
15
-
16
-
17
-
18
-
19
-
20
-
21
-
22
-
23
-
24
-
25
-
26
-
27
-
28
-
29
-
30
-
31
-
32
-
33
-
34
-
35
-
 36
36 -
 37
37 -
 38
38 -
 39
39 -
 40
40 -
 41
41 -
 42
42 -
 43
43 -
 44
44 -
 45
45 -
 46
46 -
 47
47 -
 48
48 -
 49
49 -
 50
50 -
 51
51 -
 52
52 -
 53
53 -
 54
54 -
 55
55 -
 56
56 -
57
-
58
-
59
-
60
-
61
-
62
-
63
-
64
-
65
-
66
-
67
-
68
-
69
-
70
-
71
-
72
-
73
-
74
-
75
-
76
-
77
-
78
-
79
-
80
-
81
-
82
-
83
-
84
 |
 |

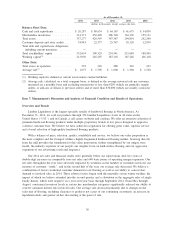
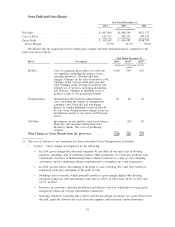
Merchandise inventories and available inventory per store in operation on December 31 were as follows:
2014 2013 2012
(in thousands)
Inventory − Available for Sale ................. $265,949 $212,617 $168,409
Inventory − Inbound In-Transit ................. 48,422 39,811 38,295
Total Merchandise Inventories ................ $314,371 $252,428 $206,704
Available Inventory Per Store ................ $ 756 $ 669 $ 585
Available inventory per store at December 31, 2014 was higher than both December 31, 2013 and
December 31, 2012 due to weaker than expected net sales, increases in merchandise categories previously
constrained and increases in moldings and accessories. In addition, inventory levels were higher as we
prepared for transition and consolidation of our East Coast distribution operations in the first quarter of 2015,
and in anticipation of Chinese New Year which was later in February than most years. Further, inventory
within our Californian distribution facility was elevated to provide a measure of safety stock while a new
labor contract was negotiated for west coast ports. We expect 2015 inventory levels to decrease in comparison
to 2014 by the end of June and normalize in the range of $640,000 to $690,000 per store throughout the
second half of 2015.
Inbound in-transit inventory generally varies due to the timing of certain international shipments and
certain seasonal factors, including international holidays, rainy seasons and specific merchandise category
planning.
Cash Flows
Operating Activities. Net cash provided by operating activities was $57.1 million for 2014,
$53.0 million for 2013, and $47.3 million for 2012. The $4.1 million increase in net cash comparing 2014 to
2013 is primarily due to an increase in customer deposits and store credits and a reduction in merchandise
inventories, net of the change in accounts payable. These increases were offset by less profitable operations.
The $5.7 million increase in net cash comparing 2013 to 2012 is primarily due to more profitable operations
which were partially offset by a larger and earlier build in merchandise inventories net of the change in
accounts payable.
Investing Activities. Net cash used in investing activities was $71.1 million for 2014, $28.6 million
for 2013, and $13.4 million for 2012. Net cash used in investing activities in each year included capital
purchases for store base expansion, and investments in and maintenance of forklifts, our integrated
information technology solution, our finishing lines and our Corporate Headquarters. In 2014 and 2013, capital
expenditures also included remodeling of existing stores to our expanded showroom format and $37.6 million
and $8.4 million, respectively, for land, buildings and equipment for the East Coast distribution facility and
$1.2 million and $2.1 million, respectively, for equipment and leasehold improvements for the West Coast
distribution facility.
Financing Activities. Net cash used by financing activities was $46.2 million in 2014, $7.4 million in
2013 and $31.9 million in 2012. We used cash of $53.3 million, $34.8 million and $49.4 million in 2014,
2013 and 2012, respectively, to repurchase our common stock, primarily under our stock repurchase program
initiated in February 2012. Stock option exercises provided $7.2 million, $27.3 million and $17.5 million in
2014, 2013 and 2012, respectively. During 2014, we borrowed $53.0 million under our revolving credit
facility to fund capital expenditures and inventory purchases, however, this amount was fully repaid by
year-end.
Revolving Credit Agreement
A revolving credit agreement (the ‘‘Revolver’’) providing for borrowings up to $50.0 million is available
to us through expiration on February 21, 2017. During 2014, we borrowed and repaid a total of $53.0 million
against the Revolver, and during 2013 and 2012, we did not borrow against the Revolver. The Revolver
supported $2.7 million and $2.3 million of letters of credit at December 31, 2014 and 2013, respectively. At
December 31, 2012, there were no outstanding commitments under letters of credit. The Revolver is primarily
available to fund inventory purchases, including the support of up to $10.0 million for letters of credit, and for
38