Lumber Liquidators 2014 Annual Report Download - page 5
Download and view the complete annual report
Please find page 5 of the 2014 Lumber Liquidators annual report below. You can navigate through the pages in the report by either clicking on the pages listed below, or by using the keyword search tool below to find specific information within the annual report.-
 1
1 -
 2
2 -
 3
3 -
 4
4 -
 5
5 -
 6
6 -
 7
7 -
 8
8 -
 9
9 -
 10
10 -
 11
11 -
 12
12 -
 13
13 -
 14
14 -
 15
15 -
 16
16 -
17
-
18
-
19
-
20
-
21
-
22
-
23
-
24
-
25
-
26
-
27
-
28
-
29
-
30
-
31
-
32
-
33
-
34
-
35
-
36
-
37
-
38
-
39
-
40
-
41
-
42
-
43
-
44
-
45
-
46
-
47
-
48
-
49
-
50
-
51
-
52
-
53
-
54
-
55
-
56
-
57
-
58
-
59
-
60
-
61
-
62
-
63
-
64
-
65
-
66
-
67
-
68
-
69
-
70
-
71
-
72
-
73
-
74
-
75
-
76
-
77
-
78
-
79
-
80
-
81
-
82
-
83
-
84
 |
 |

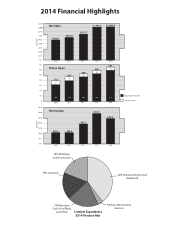
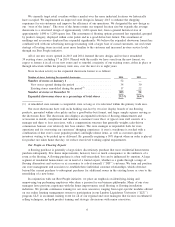
Net Sales
$250
$375
$500
$625
$750
$875
$1,000
$1,125
$125
$0
MILLIONS
40% Solid and Engineered
Hardwood
19% Laminate
19% Moldings
and Accessories
Lumber Liquidators
2014 Product Mix
Net Income
2013
$47.1
$0
$5.0
$20.0
$35.0
$50.0
$65.0
$80.0
$95.0
MILLIONS
325
Beginning of the year
Net new stores
0
75
125
175
225
275
Stores Open
2014 Financial Highlights
2013
$813.3
2014
$1,047.4
$1,000.2
2010
375
2010
2011
$620.3
2012
$681.6
2010 2011
186
223
37
2012
223
263
40
2013 2014
263
288
352
25
34
2011
$26.3
2012
$26.3
318
318
30
288
2014
$63.4
$77.4
19% Bamboo,
Cork, Vinyl Plank
and Other
3% Non-Merchandise
Services