Lumber Liquidators 2014 Annual Report Download - page 42
Download and view the complete annual report
Please find page 42 of the 2014 Lumber Liquidators annual report below. You can navigate through the pages in the report by either clicking on the pages listed below, or by using the keyword search tool below to find specific information within the annual report.-
 1
1 -
2
-
3
-
4
-
5
-
6
-
7
-
8
-
9
-
10
-
11
-
12
-
13
-
14
-
15
-
16
-
17
-
18
-
19
-
20
-
21
-
22
-
23
-
24
-
25
-
26
-
27
-
28
-
29
-
30
-
31
-
 32
32 -
 33
33 -
 34
34 -
 35
35 -
 36
36 -
 37
37 -
 38
38 -
 39
39 -
 40
40 -
 41
41 -
 42
42 -
 43
43 -
 44
44 -
 45
45 -
 46
46 -
 47
47 -
 48
48 -
 49
49 -
 50
50 -
 51
51 -
 52
52 -
53
-
54
-
55
-
56
-
57
-
58
-
59
-
60
-
61
-
62
-
63
-
64
-
65
-
66
-
67
-
68
-
69
-
70
-
71
-
72
-
73
-
74
-
75
-
76
-
77
-
78
-
79
-
80
-
81
-
82
-
83
-
84
 |
 |

Gross Profit and Gross Margin
Year Ended December 31,
2014 2013 2012
(dollars in thousands)
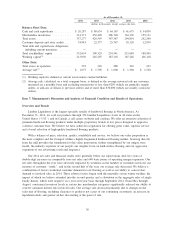
Net Sales ................................... $1,047,419 $1,000,240 $813,327
Cost of Sales ................................ 629,252 589,257 504,542
Gross Profit ................................. $ 418,167 $ 410,983 $308,785
Gross Margin ............................... 39.9% 41.1% 38.0%
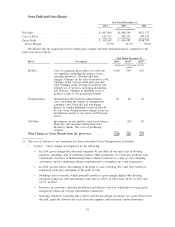
We believe that the significant drivers within gross margin and their estimated impact compared to the
prior year are as follows:
Year Ended December 31,
Driver Description 2014 2013
(1)
2012
(1)
expansion (contraction) in basis
points
Product ....... Cost of acquiring the products we sell from
our suppliers, including the impact of our
sourcing initiatives; Customs and duty
charges; Changes in the mix of products sold;
Changes in the average retail price per unit
sold; Changes in the average retail price and
related cost of services, including installation
and delivery; Changes in finishing costs to
produce a unit of our proprietary brands.
(130) 300 250
Transportation . . . International and domestic transportation
costs, including the impact of international
container rates; Fuel and fuel surcharges;
Impact of vendor shipments received directly
by our stores; Transportation charges from our
distribution centers to our stores and between
stores.
10 20 10
All Other ...... Investments in our quality control procedures;
Warranty and customer satisfaction costs;
Inventory shrink; Net costs of producing
samples.
— (10) 10
Total Change in Gross Margin from the prior year .......... (120) 310 270
(1) The cost of delivery to our customers has been reclassified from Transportation to Product.
•Product: Gross margin was impacted by the following:
䡩In 2014, gross margin was adversely impacted by net shifts in our sales mix of flooring
products, including sales of substitute product while inventories of certain key products were
constrained, clearance of Bellawood products which would not be a part of our continuing
assortment, and the marketing changes implemented to strengthen our value proposition.
䡩In 2014, greater ad-hoc discounting at the point of sale, reversing 2013 and 2012 trends of
improving retail price discipline at the point of sale.
䡩Moldings and accessories, which generally produce a gross margin higher than flooring,
increased within our total merchandise sales mix to 20.1% in 2014 from 18.9% in 2013 and
16.7% in 2012.
䡩Increases in customers choosing installation and delivery services, which have average gross
margins less than our average merchandise transaction.
䡩Sourcing initiatives, including line reviews and the percentage of product we source direct from
the mill, generally lowered net costs from our suppliers and increased vendor allowances.
34