Lumber Liquidators 2014 Annual Report Download - page 48
Download and view the complete annual report
Please find page 48 of the 2014 Lumber Liquidators annual report below. You can navigate through the pages in the report by either clicking on the pages listed below, or by using the keyword search tool below to find specific information within the annual report.-
 1
1 -
2
-
3
-
4
-
5
-
6
-
7
-
8
-
9
-
10
-
11
-
12
-
13
-
14
-
15
-
16
-
17
-
18
-
19
-
20
-
21
-
22
-
23
-
24
-
25
-
26
-
27
-
28
-
29
-
30
-
31
-
32
-
33
-
34
-
35
-
36
-
37
-
 38
38 -
 39
39 -
 40
40 -
 41
41 -
 42
42 -
 43
43 -
 44
44 -
 45
45 -
 46
46 -
 47
47 -
 48
48 -
 49
49 -
 50
50 -
 51
51 -
 52
52 -
 53
53 -
 54
54 -
 55
55 -
 56
56 -
 57
57 -
 58
58 -
59
-
60
-
61
-
62
-
63
-
64
-
65
-
66
-
67
-
68
-
69
-
70
-
71
-
72
-
73
-
74
-
75
-
76
-
77
-
78
-
79
-
80
-
81
-
82
-
83
-
84
 |
 |
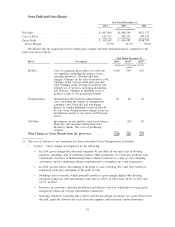
collected from customers and remitted to governmental taxing authorities. Net sales are reduced by an
allowance for anticipated sales returns that we estimate based on historical and current sales trends and
experience. We believe that our estimate for sales returns is an accurate reflection of future returns. Any
reasonably likely changes that may occur in the assumptions underlying our allowance estimates would not be
expected to have a material impact on our financial condition or operating performance. Actual sales returns
did not vary materially from estimated amounts for 2014, 2013 or 2012.
In addition, customers who do not take immediate delivery of their purchases are generally required to
pay a deposit, equal to approximately half of the retail sales value, with the balance payable when the
customer takes possession of the merchandise. These customer deposits benefit our cash flow and return on
investment capital, because we receive partial payment for our customers’ purchases immediately. We record
these deposits as a liability on our balance sheet in customer deposits and store credits until the customer
takes possession of the merchandise.
Merchandise Inventories
We value our merchandise inventories at the lower of merchandise cost or market value. We determine
merchandise cost using the average cost method. All of the hardwood flooring we purchase from suppliers
is either prefinished or unfinished, and in immediate saleable form. To the extent that we finish and box
unfinished products, we include those costs in the average unit cost of related merchandise inventory. In
determining market value, we make judgments and estimates as to the market value of our products, based
on factors such as historical results and current sales trends. Any reasonably likely changes that may occur in
those assumptions in the future may require us to record charges for losses or obsolescence against these
assets, but would not be expected to have a material impact on our financial condition or operating
performance. Actual losses and obsolescence charges did not vary materially from estimated amounts for
2014, 2013 or 2012.
Stock-Based Compensation
We currently utilize a single equity incentive plan under which we may grant non-qualified stock options,
restricted shares, stock appreciation rights and other equity awards to employees, non-employee directors and
other service providers. We recognize expense for our stock-based compensation based on the fair value of the
awards that are granted. Compensation expense is recognized only for those awards expected to vest, with
forfeitures estimated at the date of grant based on our historical experience and future expectations. Measured
compensation cost is recognized ratably over the service period of the entire related stock-based compensation
award.
The fair value of stock options was estimated at the date of grant using the Black-Scholes-Merton
valuation model. In order to determine the related stock-based compensation expense, we used the following
assumptions for stock options granted during 2014:
• Expected life of 5.5 years;
• Expected stock price volatility of 45%;
• Risk-free interest rate of 1.8%; and
• Dividends are not expected to be paid in any year.
The expected stock price volatility is based on the historical volatility of our stock price. The volatility is
estimated for a period of time equal to the expected term of the related option. The risk-free interest rate is
based on the implied yield of U.S. Treasury zero-coupon issues with an equivalent remaining term. The
expected term of the options represents the estimated period of time until exercise and is determined by
considering the contractual terms, vesting schedule and expectations of future employee behavior. Had we
arrived at different assumptions of stock price volatility or expected terms of our options, our stock-based
compensation expense and results of operations could have been different.
40