Lumber Liquidators 2014 Annual Report Download - page 64
Download and view the complete annual report
Please find page 64 of the 2014 Lumber Liquidators annual report below. You can navigate through the pages in the report by either clicking on the pages listed below, or by using the keyword search tool below to find specific information within the annual report.-
 1
1 -
2
-
3
-
4
-
5
-
6
-
7
-
8
-
9
-
10
-
11
-
12
-
13
-
14
-
15
-
16
-
17
-
18
-
19
-
20
-
21
-
22
-
23
-
24
-
25
-
26
-
27
-
28
-
29
-
30
-
31
-
32
-
33
-
34
-
35
-
36
-
37
-
38
-
39
-
40
-
41
-
42
-
43
-
44
-
45
-
46
-
47
-
48
-
49
-
50
-
51
-
52
-
53
-
 54
54 -
 55
55 -
 56
56 -
 57
57 -
 58
58 -
 59
59 -
 60
60 -
 61
61 -
 62
62 -
 63
63 -
 64
64 -
 65
65 -
 66
66 -
 67
67 -
 68
68 -
 69
69 -
 70
70 -
 71
71 -
 72
72 -
 73
73 -
 74
74 -
75
-
76
-
77
-
78
-
79
-
80
-
81
-
82
-
83
-
84
 |
 |

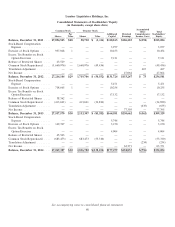
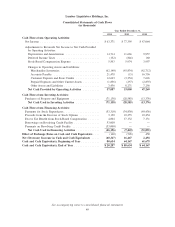
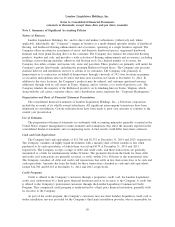
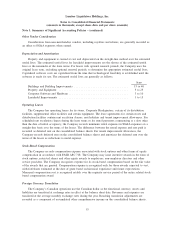
Lumber Liquidators Holdings, Inc.
Notes to Consolidated Financial Statements
(amounts in thousands, except share data and per share amounts)
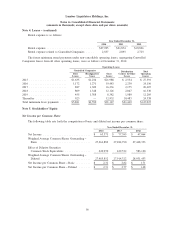
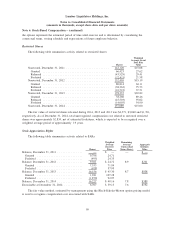
Note 4. Leases − (continued)
Rental expense is as follows:
Year Ended December 31,
2014 2013 2012
Rental expense ............................ $27,995 $21,874 $18,826
Rental expense related to Controlled Companies ..... 2,837 2,895 2,725
The future minimum rental payments under non-cancellable operating leases, segregating Controlled
Companies leases from all other operating leases, were as follows at December 31, 2014:
Operating Leases
Controlled Companies
Store
Leases
Distribution
Centers & Other
Leases
Total
Operating
Leases
Store
Leases
Headquarters
Lease
2015 ...................... $1,635 $1,234 $21,988 $ 2,534 $ 27,391
2016 ...................... 1,172 1,271 19,483 2,230 24,156
2017 ...................... 887 1,309 16,236 2,175 20,607
2018 ...................... 809 1,348 12,126 2,047 16,330
2019 ...................... 455 1,388 8,382 1,980 12,205
Thereafter .................. 923 — 12,932 10,483 24,338
Total minimum lease payments .... $5,881 $6,550 $91,147 $21,449 $125,027
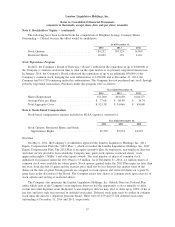
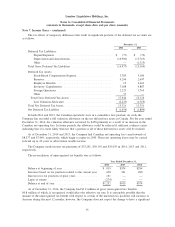
Note 5. Stockholders’ Equity
Net Income per Common Share
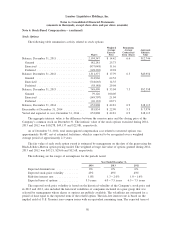
The following table sets forth the computation of basic and diluted net income per common share:
Year Ended December 31,
2014 2013 2012
Net Income ............................ $ 63,371 $ 77,395 $ 47,064
Weighted Average Common Shares Outstanding −
Basic .............................. 27,264,882 27,484,790 27,448,333
Effect of Dilutive Securities:
Common Stock Equivalents ............... 220,970 429,532 583,120
Weighted Average Common Shares Outstanding −
Diluted ............................. 27,485,852 27,914,322 28,031,453
Net Income per Common Share − Basic ......... $ 2.32 $ 2.82 $ 1.71
Net Income per Common Share − Diluted ....... $ 2.31 $ 2.77 $ 1.68
56