Lumber Liquidators 2014 Annual Report Download - page 57
Download and view the complete annual report
Please find page 57 of the 2014 Lumber Liquidators annual report below. You can navigate through the pages in the report by either clicking on the pages listed below, or by using the keyword search tool below to find specific information within the annual report.-
 1
1 -
2
-
3
-
4
-
5
-
6
-
7
-
8
-
9
-
10
-
11
-
12
-
13
-
14
-
15
-
16
-
17
-
18
-
19
-
20
-
21
-
22
-
23
-
24
-
25
-
26
-
27
-
28
-
29
-
30
-
31
-
32
-
33
-
34
-
35
-
36
-
37
-
38
-
39
-
40
-
41
-
42
-
43
-
44
-
45
-
46
-
 47
47 -
 48
48 -
 49
49 -
 50
50 -
 51
51 -
 52
52 -
 53
53 -
 54
54 -
 55
55 -
 56
56 -
 57
57 -
 58
58 -
 59
59 -
 60
60 -
 61
61 -
 62
62 -
 63
63 -
 64
64 -
 65
65 -
 66
66 -
 67
67 -
68
-
69
-
70
-
71
-
72
-
73
-
74
-
75
-
76
-
77
-
78
-
79
-
80
-
81
-
82
-
83
-
84
 |
 |

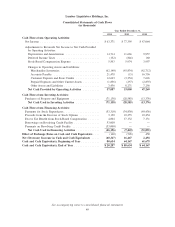
Lumber Liquidators Holdings, Inc.
Consolidated Statements of Cash Flows
(in thousands)
Year Ended December 31,
2014 2013 2012
Cash Flows from Operating Activities:
Net Income ................................... $63,371 $ 77,395 $ 47,064
Adjustments to Reconcile Net Income to Net Cash Provided
by Operating Activities:
Depreciation and Amortization .................... 14,714 11,666 9,957
Deferred Income Taxes ......................... (152) (846) 160
Stock-Based Compensation Expense ................ 5,593 5,974 3,997
Changes in Operating Assets and Liabilities:
Merchandise Inventories ....................... (62,140) (45,834) (42,712)
Accounts Payable ........................... 21,478 (15) 16,756
Customer Deposits and Store Credits .............. 12,623 (3,354) 7,626
Prepaid Expenses and Other Current Assets .......... (1,836) (257) (2,835)
Other Assets and Liabilities ..................... 3,436 8,271 7,256
Net Cash Provided by Operating Activities .......... 57,087 53,000 47,269
Cash Flows from Investing Activities:
Purchases of Property and Equipment ................. (71,138) (28,585) (13,376)
Net Cash Used in Investing Activities .............. (71,138) (28,585) (13,376)
Cash Flows from Financing Activities:
Payments for Stock Repurchases ..................... (53,310) (34,830) (49,436)
Proceeds from the Exercise of Stock Options ............ 3,150 10,255 10,454
Excess Tax Benefit from Stock-Based Compensation ....... 4,004 17,132 7,131
Borrowings on Revolving Credit Facility ............... 53,000 — —
Payments on Revolving Credit Facility ................ (53,000) — —
Net Cash Used in Financing Activities .............. (46,156) (7,443) (31,851)
Effect of Exchange Rates on Cash and Cash Equivalents .... (140) (505) 450
Net (Decrease) Increase in Cash and Cash Equivalents ..... (60,347) 16,467 2,492
Cash and Cash Equivalents, Beginning of Year ........... 80,634 64,167 61,675
Cash and Cash Equivalents, End of Year ............... $ 20,287 $ 80,634 $ 64,167
See accompanying notes to consolidated financial statements
49