Lumber Liquidators 2014 Annual Report Download - page 43
Download and view the complete annual report
Please find page 43 of the 2014 Lumber Liquidators annual report below. You can navigate through the pages in the report by either clicking on the pages listed below, or by using the keyword search tool below to find specific information within the annual report.-
 1
1 -
2
-
3
-
4
-
5
-
6
-
7
-
8
-
9
-
10
-
11
-
12
-
13
-
14
-
15
-
16
-
17
-
18
-
19
-
20
-
21
-
22
-
23
-
24
-
25
-
26
-
27
-
28
-
29
-
30
-
31
-
32
-
 33
33 -
 34
34 -
 35
35 -
 36
36 -
 37
37 -
 38
38 -
 39
39 -
 40
40 -
 41
41 -
 42
42 -
 43
43 -
 44
44 -
 45
45 -
 46
46 -
 47
47 -
 48
48 -
 49
49 -
 50
50 -
 51
51 -
 52
52 -
 53
53 -
54
-
55
-
56
-
57
-
58
-
59
-
60
-
61
-
62
-
63
-
64
-
65
-
66
-
67
-
68
-
69
-
70
-
71
-
72
-
73
-
74
-
75
-
76
-
77
-
78
-
79
-
80
-
81
-
82
-
83
-
84
 |
 |

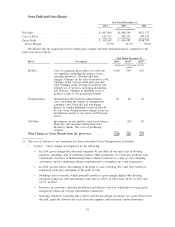
•Transportation: Gross margin was impacted by changes in our supply chain structure, changes in
international and domestic transportation rates and certain operational efficiencies.
䡩Gross margin benefited in 2014 and 2013 from generally lower average international
transportation rates. In 2014, lower international rates were primarily driven by shipments to
our West Coast distribution center, which were significantly less than rates to the East Coast.
䡩Gross margin in 2014 was not materially impacted by domestic costs other than delivery, as the
increase in domestic miles traveled due to increasing inventory levels was offset by a net lower
average cost per domestic mile. In 2013, gross margin benefited from lower aggregate domestic
costs as the impact of the reduction in the average cost per mile traveled was greater than the
impact of increased domestic miles.
•All Other Costs: Gross margin was impacted in 2014 due to greater costs of merchandise
obsolescence and shrink, including increased inventory reserves, and our increased investment in
quality control and assurance, offset by lower sample and customer satisfaction costs.
䡩Higher total inventory levels carried throughout 2014 and the significant product transitions due
to the Bellawood transition and efforts to mitigate the adverse impact of constrained inventory
with substitute product resulted in higher 2014 shrink and an increase in the inventory reserve
for loss or obsolescence. Inventory obsolescence and shrink increased 24.3% in comparing 2014
to 2013, and the reserve at December 31, 2014 was $3.2 million, up from $1.3 million at the
end of 2013.
䡩In 2013 and 2012, gross margin benefitted from supply chain initiatives to improve the
accuracy and visibility of product movement within the distribution centers and the stores,
thereby lowering inventory shrink.
䡩Improvements to production efficiency lowered the cost per sample, more than offsetting an
increase in sample requests.
䡩Investments in quality control and customer support training, combined with improved control
over installation, resulted in lower aggregate customer satisfaction costs.
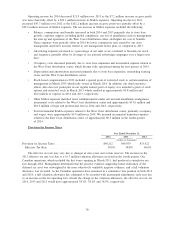
Operating Income and Operating Margin
Year Ended December 31,
2014 2013 2012
(dollars in thousands)
Gross Profit ................................... $418,167 $410,983 $308,785
SG&A Expenses ................................ 314,094 284,960 230,439
Operating Income ............................... $104,073 $126,023 $ 78,346
Operating Margin .............................. 9.9% 12.6% 9.6%
The following table sets forth components of our SG&A expenses for the periods indicated, as
a percentage of net sales. Individual line items include the impact of our finishing operations, with a credit for
these expenses included in other SG&A expenses.
Year Ended December 31,
2014 2013 2012
Total SG&A Expenses ........................... 30.0% 28.5% 28.3%
Salaries, Commissions and Benefits .................. 11.8% 12.1% 12.1%
Advertising .................................. 7.9% 7.6% 7.2%
Occupancy .................................. 4.2% 3.5% 3.7%
Depreciation and Amortization ..................... 1.4% 1.1% 1.2%
Stock-based Compensation ........................ 0.5% 0.6% 0.5%
Other SG&A Expenses .......................... 4.2% 3.6% 3.6%
35