Lumber Liquidators 2014 Annual Report Download - page 41
Download and view the complete annual report
Please find page 41 of the 2014 Lumber Liquidators annual report below. You can navigate through the pages in the report by either clicking on the pages listed below, or by using the keyword search tool below to find specific information within the annual report.-
 1
1 -
2
-
3
-
4
-
5
-
6
-
7
-
8
-
9
-
10
-
11
-
12
-
13
-
14
-
15
-
16
-
17
-
18
-
19
-
20
-
21
-
22
-
23
-
24
-
25
-
26
-
27
-
28
-
29
-
30
-
 31
31 -
 32
32 -
 33
33 -
 34
34 -
 35
35 -
 36
36 -
 37
37 -
 38
38 -
 39
39 -
 40
40 -
 41
41 -
 42
42 -
 43
43 -
 44
44 -
 45
45 -
 46
46 -
 47
47 -
 48
48 -
 49
49 -
 50
50 -
 51
51 -
52
-
53
-
54
-
55
-
56
-
57
-
58
-
59
-
60
-
61
-
62
-
63
-
64
-
65
-
66
-
67
-
68
-
69
-
70
-
71
-
72
-
73
-
74
-
75
-
76
-
77
-
78
-
79
-
80
-
81
-
82
-
83
-
84
 |
 |

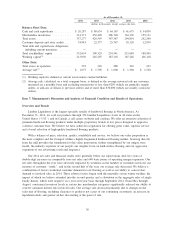
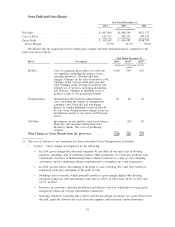
(1) Average retail price per unit sold is calculated on a total company basis and excludes non-merchandise
revenue.
(2) A cannibalized market has at least one comparable store and one non-comparable store.
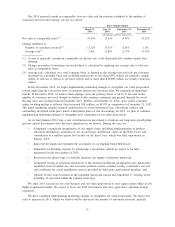
Net sales for 2014 increased $47.2 million, or 4.7%, over 2013 as net sales in comparable stores
decreased $42.9 million and net sales in non-comparable stores increased $90.1 million. Net sales in 2014
were impacted by the following factors:
• Net sales in comparable stores decreased 4.3% comparing 2014 to 2013 as a result of a decrease of
2.5% attributable to the number of customers invoiced and a decrease of 1.8% in the average sale.
• We believe the number of customers invoiced decreased primarily due to the net effect of
constrained inventory in certain key product categories, overall weakness in customer demand for
wood flooring and the adverse impact of winter weather, unusual in severity, geographic scale and
duration.
䡩We believe up to $24 million of net sales were lost due to constrained inventory levels of
certain key merchandise categories, primarily laminate, vinyl plank and engineered hardwood,
as customer demand was either lost or converted to substitute products at lower retail prices.
䡩We believe the severity of the weather required a number of customers to reprioritize home
improvement projects, including flooring, and a portion of that demand was either delayed
to 2015 or indefinitely suspended. We estimated approximately 650 basis points of
underperformance in comparing the net sales in 131 of our stores operating in areas most
severely impacted and net sales in the remainder of our stores.
• A lower average sale in 2014 was due to a 1.9% net decrease in the average retail price per unit
sold, partially offset by an increase in the number of units sold. Changes in the sales mix of
flooring, including clearance of products not a part of our continuing assortment, an increase in
liquidation deals and greater ad-hoc discounting at the point of sale drove down the average retail
price per unit sold. Partially offsetting this decrease were increases in sales mix of moldings and
accessories, non-merchandise services and Bellawood products.
• Seven store locations serving communities recovering from the effects of Hurricane Sandy reduced
total comparable store net sales by 35 to 45 basis points in 2014. Comparable store net sales
benefited 40 to 50 basis points in 2013 from these locations.
• Store base expansion drove the increase in non-comparable store net sales as we expanded our store
base unit count by 10.7%, 10.4% and 9.5% in 2014, 2013 and 2012, respectively, with 34, 30 and
25 locations, respectively, opened in existing markets where brand awareness tends to increase
first year net sales per unit relative to a new market.
• Net sales of delivery and installation services were $32.3 million in 2014, up from $16.1 million
in 2013.
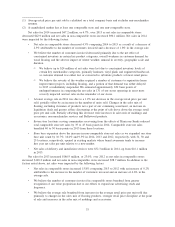
Net sales for 2013 increased $186.9 million, or 23.0%, over 2012 as net sales in comparable stores
increased $128.2 million and net sales in non-comparable stores increased $58.7 million. In addition to the
factors noted above, net sales were impacted by the following factors:
• Net sales in comparable stores increased 15.8% comparing 2013 to 2012 with an increase of 9.2%
attributable to the increase in the number of customers invoiced and an increase of 6.6% in the
average sale.
• We believe the number of customers invoiced in comparable stores benefited from greater
recognition of our value proposition due to our efforts to expand our advertising reach and
frequency.
• We believe the average sale benefited from increases in the average retail price per unit sold due
primarily to changes in the sales mix of flooring products, stronger retail price discipline at the point
of sale and increases in the sales mix of moldings and accessories.
33