Lumber Liquidators 2014 Annual Report Download - page 45
Download and view the complete annual report
Please find page 45 of the 2014 Lumber Liquidators annual report below. You can navigate through the pages in the report by either clicking on the pages listed below, or by using the keyword search tool below to find specific information within the annual report.-
 1
1 -
2
-
3
-
4
-
5
-
6
-
7
-
8
-
9
-
10
-
11
-
12
-
13
-
14
-
15
-
16
-
17
-
18
-
19
-
20
-
21
-
22
-
23
-
24
-
25
-
26
-
27
-
28
-
29
-
30
-
31
-
32
-
33
-
34
-
 35
35 -
 36
36 -
 37
37 -
 38
38 -
 39
39 -
 40
40 -
 41
41 -
 42
42 -
 43
43 -
 44
44 -
 45
45 -
 46
46 -
 47
47 -
 48
48 -
 49
49 -
 50
50 -
 51
51 -
 52
52 -
 53
53 -
 54
54 -
 55
55 -
56
-
57
-
58
-
59
-
60
-
61
-
62
-
63
-
64
-
65
-
66
-
67
-
68
-
69
-
70
-
71
-
72
-
73
-
74
-
75
-
76
-
77
-
78
-
79
-
80
-
81
-
82
-
83
-
84
 |
 |

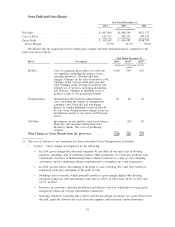
Net Income
Year Ended December 31,
2014 2013 2012
(dollars in thousands)
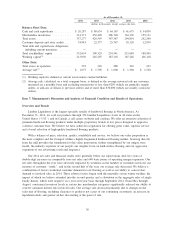
Net Income .................................... $63,371 $77,395 $47,064
As a percentage of net sales ....................... 6.1% 7.7% 5.8%
Net income for the year ended December 31, 2014 decreased 18.1% over the year ended December 31,
2013. Net income for the year ended December 31, 2013 increased 64.4% over the year ended December 31,
2012.
Liquidity and Capital Resources
Our principal liquidity and capital requirements are for capital expenditures to maintain and grow our
business, working capital and general corporate purposes. We periodically use excess cash flow to repurchase
shares of our common stock under our stock repurchase program. Our principal sources of liquidity are
$20.3 million of cash and cash equivalents at December 31, 2014, our cash flow from operations, and
$47.3 million of availability under our revolving credit facility. We believe that cash flow from operations,
together with existing liquidity sources, will be sufficient to fund our operations and anticipated capital
expenditures for the foreseeable future.
In 2015, we expect capital expenditures to total between $25 million and $35 million. In addition to
general capital requirements, we intend to:
• open between 30 and 35 new store locations, using up to $10 million of cash;
• remodel or relocate 15 to 20 existing stores, using up to $5 million of cash;
• complete our East Coast distribution center and new finishing line;
• continue to invest in vertical integration initiatives;
• continue to invest in integrated information technology systems; and
• continue to improve the effectiveness of our marketing programs.
Cash and Cash Equivalents
In 2014, cash and cash equivalents decreased $60.3 million to $20.3 million. The decrease of cash and
cash equivalents was primarily due to $53.3 million of net cash used to repurchase common stock and
$71.1 million for capital expenditures partially offset by net cash provided by operating activities of
$57.1 million.
In 2013, cash and cash equivalents increased $16.5 million to $80.6 million. The increase of cash and
cash equivalents was primarily due to $53.0 million of net cash provided by operating activities and
$27.4 million of proceeds received from stock option exercises which was partially offset by the use of
$34.8 million to repurchase common stock and $28.6 million for capital expenditures.
In 2012, cash and cash equivalents increased $2.5 million to $64.2 million. The increase of cash and cash
equivalents was primarily due to $47.3 million of net cash provided by operating activities and $17.6 million
of proceeds received from stock option exercises which was partially offset by the use of $49.4 million to
repurchase common stock and $13.4 million for capital expenditures.
Merchandise Inventories
Merchandise inventory is our most significant asset, and is considered either ‘‘available for sale’’ or
‘‘inbound in-transit,’’ based on whether we have physically received and inspected the products at an
individual store location, in our distribution centers or in another facility where we control and monitor
inspection.
37