Lumber Liquidators 2014 Annual Report Download - page 44
Download and view the complete annual report
Please find page 44 of the 2014 Lumber Liquidators annual report below. You can navigate through the pages in the report by either clicking on the pages listed below, or by using the keyword search tool below to find specific information within the annual report.-
 1
1 -
2
-
3
-
4
-
5
-
6
-
7
-
8
-
9
-
10
-
11
-
12
-
13
-
14
-
15
-
16
-
17
-
18
-
19
-
20
-
21
-
22
-
23
-
24
-
25
-
26
-
27
-
28
-
29
-
30
-
31
-
32
-
33
-
 34
34 -
 35
35 -
 36
36 -
 37
37 -
 38
38 -
 39
39 -
 40
40 -
 41
41 -
 42
42 -
 43
43 -
 44
44 -
 45
45 -
 46
46 -
 47
47 -
 48
48 -
 49
49 -
 50
50 -
 51
51 -
 52
52 -
 53
53 -
 54
54 -
55
-
56
-
57
-
58
-
59
-
60
-
61
-
62
-
63
-
64
-
65
-
66
-
67
-
68
-
69
-
70
-
71
-
72
-
73
-
74
-
75
-
76
-
77
-
78
-
79
-
80
-
81
-
82
-
83
-
84
 |
 |

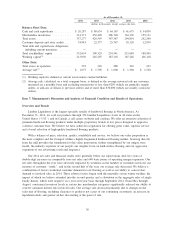
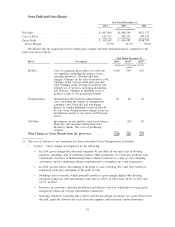
Operating income for 2014 decreased $21.9 million over 2013 as the $7.2 million increase in gross profit
was more than fully offset by a $29.1 million increase in SG&A expenses. Operating income for 2013
increased $47.7 million over 2012 as the $102.2 million increase in gross profit was partially offset by a
$54.5 million increase in SG&A expenses. The net increase in SG&A expenses included the following:
• Salaries, commissions and benefits increased in both 2014 and 2013 primarily due to store base
growth, corporate support, including global compliance, our test of installation services management,
the start-up and operations of the West Coast distribution center and higher net cost of benefits.
These expenses were partially offset in 2014 by lower commission rates earned by our store
management and lower accruals related to our management bonus plan, as compared to 2013.
• Advertising expenses increased as a percentage of net sales as we continued to broaden our reach
and frequency, partially offset by leverage of our national advertising campaigns over a larger store
base.
• Occupancy costs increased primarily due to store base expansion and incremental expense related to
the West Coast distribution center, which became fully operational during the first quarter of 2014.
• Depreciation and amortization increased primarily due to store base expansion, remodeling existing
stores and the West Coast distribution center.
• Stock-based compensation in 2013 included a special grant of restricted stock to certain members of
management in March 2013 which fully vested in March 2014. In addition, our chief executive
officer, who does not participate in our regular annual grant of equity, was awarded a grant of stock
options and restricted stock in March 2013 which resulted in approximately $0.8 million and
$0.6 million of expense in 2014 and 2013, respectively.
• Other SG&A expenses included lower reimbursements under our national installation arrangement,
incremental costs related to the West Coast distribution center and approximately $13.6 million and
$10.6 million of legal and professional fees in 2014 and 2013, respectively.
• Total incremental SG&A expenses related to the West Coast distribution center, primarily occupancy
and wages, were approximately $5.9 million in 2014. We incurred incremental transition expenses
related to the East Coast distribution center of approximately $0.5 million in the fourth quarter
of 2014.
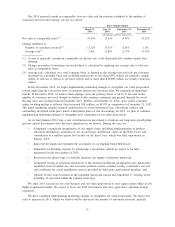
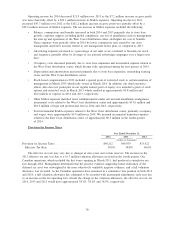
Provision for Income Taxes
Year Ended December 31,
2014 2013 2012
(dollars in thousands)
Provision for Income Taxes ......................... $40,212 $49,070 $31,422
Effective Tax Rate ............................. 38.8% 38.8% 40.0%
The effective tax rate may vary due to changes in state taxes and certain reserves. The increase in the
2012 effective tax rate was due to a $1.3 million valuation allowance recorded in the fourth quarter. Our
Canadian operations, which included the first stores opening in March 2011, had produced a cumulative net
loss through 2012. Management determined that the positive evidence supporting future realization of the
deferred tax asset was outweighed by the more objectively verifiable negative evidence, and a full valuation
allowance was recorded. As the Canadian operations have remained in a cumulative loss position in both 2013
and 2014, a full valuation allowance has continued to be recorded with incremental adjustments each year due
to an increase in the net operating loss. Absent the change in the valuation allowance, the effective tax rate for
2014, 2013 and 2012 would have approximated 38.1%, 38.2% and 38.5%, respectively.
36