Lumber Liquidators 2014 Annual Report Download - page 39
Download and view the complete annual report
Please find page 39 of the 2014 Lumber Liquidators annual report below. You can navigate through the pages in the report by either clicking on the pages listed below, or by using the keyword search tool below to find specific information within the annual report.-
 1
1 -
2
-
3
-
4
-
5
-
6
-
7
-
8
-
9
-
10
-
11
-
12
-
13
-
14
-
15
-
16
-
17
-
18
-
19
-
20
-
21
-
22
-
23
-
24
-
25
-
26
-
27
-
28
-
 29
29 -
 30
30 -
 31
31 -
 32
32 -
 33
33 -
 34
34 -
 35
35 -
 36
36 -
 37
37 -
 38
38 -
 39
39 -
 40
40 -
 41
41 -
 42
42 -
 43
43 -
 44
44 -
 45
45 -
 46
46 -
 47
47 -
 48
48 -
 49
49 -
50
-
51
-
52
-
53
-
54
-
55
-
56
-
57
-
58
-
59
-
60
-
61
-
62
-
63
-
64
-
65
-
66
-
67
-
68
-
69
-
70
-
71
-
72
-
73
-
74
-
75
-
76
-
77
-
78
-
79
-
80
-
81
-
82
-
83
-
84
 |
 |

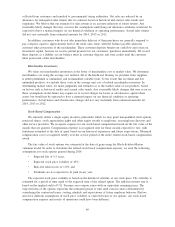
Our 2014 quarterly trends in comparable store net sales and the portions attributed to the number of
customers invoiced and average sale are as follows:
Three Months Ended
March 31,
2014
June 30,
2014
September 30,
2014
December 31,
2014
percentage increase (decrease)
Net sales at comparable stores
(1)
.......... (0.6)% (7.1)% (4.9)% (4.2)%
Change attributed to:
Number of customers invoiced
(2)
........ (3.2)% (5.3)% (2.6)% 1.1%
Average sale
(3)
..................... 2.6% (1.8)% (2.3)% (5.3)%
(1) A store is generally considered comparable on the first day of the thirteenth full calendar month after
opening.
(2) Change in number of customers invoiced which is calculated by applying our average sale to total net
sales at comparable stores.
(3) Average sale, calculated on a total company basis, is defined as the average invoiced sale per customer,
measured on a monthly basis and excluding transactions of less than $250 (which are generally sample
orders, or add-ons or fill-ins to previous orders) and of more than $30,000 (which are usually contractor
orders).
In late November 2014, we began implementing marketing changes to strengthen our value proposition
toward improving the conversion rates of customer interest into invoiced sales. We experienced immediate
benefit. In December 2014, we believe these changes were the primary driver of an 8.1% increase in the
number of customers invoiced, though we believe both consumer sentiment and general demand for wood
flooring were also stronger than in December 2013. Further, at December 31, 2014, open orders (customer
orders awaiting pickup or delivery) had increased $18 million, or 69.0% in comparison to December 31, 2013.
The initial marketing changes featured modifications to our promotional focus, advertising cadence and
outstanding advertised retail price points with limited point of sale discounting. In 2015, we plan to continue
implementing marketing changes to strengthen each component of our value proposition.
As we had planned, 2014 was a year of infrastructure investment to facilitate our long-term growth plans,
and our capital investments were the most significant in our history. During the year, we:
• Completed a significant optimization of our supply chain, including implementation of product
allocation intelligence, operation of our second major distribution center on the West Coast, and
construction of a million square foot facility on the East Coast, which was fully operational in
January 2015;
• Improved the finish and expanded the assortment of our flagship brand Bellawood;
• Expanded our finishing capacity by purchasing a second line, which we expect to be fully
operational in the first quarter of 2015;
• Invested in the initial steps to vertically integrate our supply of domestic hardwood;
• Completed testing of structural alternatives to the national installation arrangement and significantly
expanded stores in which our own associates perform certain customer-facing, consultative services
and coordinate the actual installation services provided by third-party professional installers; and
• Opened 34 new store locations in the expanded showroom format and remodeled 17 existing stores,
including 13 relocated within the primary trade area.
We enter 2015 focused on our core business and our value proposition to once again capture share in our
highly fragmented market. We expect to lever our 2014 investments and once again drive operating margin
expansion.
We have continued implementing marketing changes to strengthen our value proposition. We expect net
sales to increase in 2015, which we believe will be driven by the number of customers invoiced, partially
31