Logitech 2004 Annual Report Download - page 78
Download and view the complete annual report
Please find page 78 of the 2004 Logitech annual report below. You can navigate through the pages in the report by either clicking on the pages listed below, or by using the keyword search tool below to find specific information within the annual report.-
 1
1 -
2
-
3
-
4
-
5
-
6
-
7
-
8
-
9
-
10
-
11
-
12
-
13
-
14
-
15
-
16
-
17
-
18
-
19
-
20
-
21
-
22
-
23
-
24
-
25
-
26
-
27
-
28
-
29
-
30
-
31
-
32
-
33
-
34
-
35
-
36
-
37
-
38
-
39
-
40
-
41
-
42
-
43
-
44
-
45
-
46
-
47
-
48
-
49
-
50
-
51
-
52
-
53
-
54
-
55
-
56
-
57
-
58
-
59
-
60
-
61
-
62
-
63
-
64
-
65
-
66
-
67
-
 68
68 -
 69
69 -
 70
70 -
 71
71 -
 72
72 -
 73
73 -
 74
74 -
 75
75 -
 76
76 -
 77
77 -
 78
78 -
 79
79 -
 80
80 -
 81
81 -
 82
82 -
 83
83 -
 84
84 -
 85
85 -
 86
86 -
 87
87 -
 88
88 -
89
-
90
-
91
-
92
-
93
-
94
-
95
-
96
-
97
-
98
-
99
-
100
-
101
-
102
-
103
-
104
-
105
-
106
-
107
-
108
-
109
-
110
-
111
-
112
-
113
-
114
-
115
-
116
-
117
-
118
-
119
-
120
-
121
-
122
-
123
-
124
-
125
-
126
-
127
-
128
-
129
-
130
-
131
-
132
-
133
-
134
-
135
 |
 |

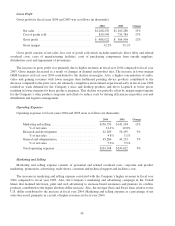
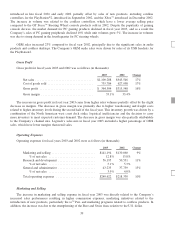
Research and Development
The increase in research and development expense was mainly due to the higher personnel expenses for the
development of new products. In addition, the increase was due to the strengthening of the Euro and Swiss franc
relative to the U.S. dollar.
General and Administrative
The increase in general and administrative expense was primarily due to increased information technology
costs to support the engineering, operations and human resource functions. In addition, the increase also related
to increased personnel to support the growth of the Company’s business and the strengthening of the Euro and
Swiss franc relative to the U.S. dollar.
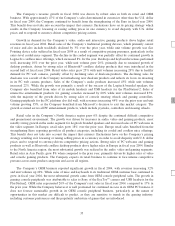
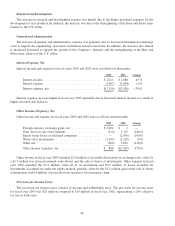
Interest Expense, Net
Interest income and expense for fiscal years 2003 and 2002 were as follows (in thousands):
2003 2002 Change
Interest income .................................... $2,411 $1,688 43%
Interest expense ................................... (3,607) (3,644) (1)%
Interest expense, net ................................ $(1,196) $(1,956) (39)%
Interest expense, net was higher in fiscal year 2002 primarily due to increased interest income as a result of
higher invested cash balances.
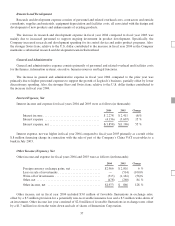
Other Income (Expense), Net
Other income and expense for fiscal years 2003 and 2002 were as follows (in thousands):
2003 2002 Change
Foreign currency exchange gains, net .................. $2,801 $ 2 —
Gain (loss) on sale of investments ..................... (514) 1,115 (146)%
Equity in net losses of affiliated companies ............. — (2,476) (100)%
Write-off of investments ............................ (1,161) (1,220) (5)%
Other,net ........................................ (260) 1,012 (126)%
Other income (expense), net ......................... $ 866 $(1,567) (155)%
Other income in fiscal year 2003 included $2.8 million of favorable fluctuations in exchange rates offset by
a $1.7 million loss from investment write-downs and the sale of shares of investments. Other expense in fiscal
year 2002 included the $1.2 million write-off of an investment and $2.5 million of losses recorded for
investments accounted for under the equity method, partially offset by the $1.1 million gain on the sale of shares
in Immersion and $.6 million of proceeds from a property loss insurance claim.
Provision for Income Taxes
The provision for income taxes consists of income and withholding taxes. The provision for income taxes
for fiscal year 2003 was $25 million compared to $19 million in fiscal year 2002, representing a 20% effective
tax rate in both years.
40