Logitech 2004 Annual Report Download - page 74
Download and view the complete annual report
Please find page 74 of the 2004 Logitech annual report below. You can navigate through the pages in the report by either clicking on the pages listed below, or by using the keyword search tool below to find specific information within the annual report.-
 1
1 -
2
-
3
-
4
-
5
-
6
-
7
-
8
-
9
-
10
-
11
-
12
-
13
-
14
-
15
-
16
-
17
-
18
-
19
-
20
-
21
-
22
-
23
-
24
-
25
-
26
-
27
-
28
-
29
-
30
-
31
-
32
-
33
-
34
-
35
-
36
-
37
-
38
-
39
-
40
-
41
-
42
-
43
-
44
-
45
-
46
-
47
-
48
-
49
-
50
-
51
-
52
-
53
-
54
-
55
-
56
-
57
-
58
-
59
-
60
-
61
-
62
-
63
-
 64
64 -
 65
65 -
 66
66 -
 67
67 -
 68
68 -
 69
69 -
 70
70 -
 71
71 -
 72
72 -
 73
73 -
 74
74 -
 75
75 -
 76
76 -
 77
77 -
 78
78 -
 79
79 -
 80
80 -
 81
81 -
 82
82 -
 83
83 -
 84
84 -
85
-
86
-
87
-
88
-
89
-
90
-
91
-
92
-
93
-
94
-
95
-
96
-
97
-
98
-
99
-
100
-
101
-
102
-
103
-
104
-
105
-
106
-
107
-
108
-
109
-
110
-
111
-
112
-
113
-
114
-
115
-
116
-
117
-
118
-
119
-
120
-
121
-
122
-
123
-
124
-
125
-
126
-
127
-
128
-
129
-
130
-
131
-
132
-
133
-
134
-
135
 |
 |

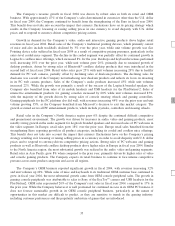
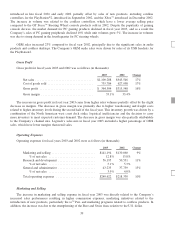
Gross Profit
Gross profit for fiscal years 2004 and 2003 was as follows (in thousands):
2004 2003 Change
Net sales ................................... $1,268,470 $1,100,288 15%
Cost of goods sold ........................... 859,548 735,784 17%
Grossprofit ................................. $ 408,922 $ 364,504 12%
Grossmargin................................ 32.2% 33.1%
Gross profit consists of net sales, less cost of goods sold which includes materials, direct labor and related
overhead costs, costs of manufacturing facilities, costs of purchasing components from outside suppliers,
distribution costs and impairment of inventories.
The increase in gross profit was primarily due to higher revenues in fiscal year 2004 compared to fiscal year
2003. Gross margin decreased as a result of changes in channel and product mix. The increase in lower margin
OEM business in fiscal year 2004 contributed to the decline in margins. Also, a higher concentration of audio,
video and gaming revenues with lower margins than traditional pointing device products contributed to the
decrease compared to the prior year. An intensely competitive environment experienced early in fiscal year 2004
resulted in weak demand for the Company’s mice and desktop products and drove Logitech to lower prices
resulting in lower margins for these product categories. This decline was partially offset by margin improvements
for the Company’s other product categories and efforts to reduce costs by driving efficiencies in product cost and
distribution and logistics management.
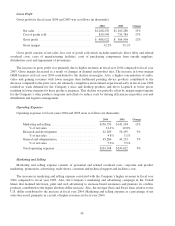
Operating Expenses
Operating expenses for fiscal years 2004 and 2003 were as follows (in thousands):
2004 2003 Change
Marketing and selling ............................ $156,793 $141,194 11%
% of net sales .............................. 12.4% 12.8%
Research and development ........................ 61,289 56,195 9%
% of net sales .............................. 4.8% 5.1%
General and administrative ........................ 45,286 43,233 5%
% of net sales .............................. 3.6% 3.9%
Total operating expenses ......................... $263,368 $240,622 9%
Marketing and Selling
Marketing and selling expense consists of personnel and related overhead costs, corporate and product
marketing, promotions, advertising, trade shows, customer and technical support and facilities costs.
The increase in marketing and selling expense correlated with the Company’s higher revenues in fiscal year
2004 compared to fiscal year 2003. Also, the Company’s marketing and advertising campaign in the United
States that featured television, print and web advertising to increase brand awareness and promote its cordless
products contributed to the higher absolute dollar increase. Also, the stronger Euro and Swiss franc relative to the
U.S. dollar contributed to the increase in fiscal year 2004. Marketing and selling expense as a percentage of net
sales decreased, primarily as a result of higher revenues in fiscal year 2004.
36