Logitech 2004 Annual Report Download - page 76
Download and view the complete annual report
Please find page 76 of the 2004 Logitech annual report below. You can navigate through the pages in the report by either clicking on the pages listed below, or by using the keyword search tool below to find specific information within the annual report.-
 1
1 -
2
-
3
-
4
-
5
-
6
-
7
-
8
-
9
-
10
-
11
-
12
-
13
-
14
-
15
-
16
-
17
-
18
-
19
-
20
-
21
-
22
-
23
-
24
-
25
-
26
-
27
-
28
-
29
-
30
-
31
-
32
-
33
-
34
-
35
-
36
-
37
-
38
-
39
-
40
-
41
-
42
-
43
-
44
-
45
-
46
-
47
-
48
-
49
-
50
-
51
-
52
-
53
-
54
-
55
-
56
-
57
-
58
-
59
-
60
-
61
-
62
-
63
-
64
-
65
-
 66
66 -
 67
67 -
 68
68 -
 69
69 -
 70
70 -
 71
71 -
 72
72 -
 73
73 -
 74
74 -
 75
75 -
 76
76 -
 77
77 -
 78
78 -
 79
79 -
 80
80 -
 81
81 -
 82
82 -
 83
83 -
 84
84 -
 85
85 -
 86
86 -
87
-
88
-
89
-
90
-
91
-
92
-
93
-
94
-
95
-
96
-
97
-
98
-
99
-
100
-
101
-
102
-
103
-
104
-
105
-
106
-
107
-
108
-
109
-
110
-
111
-
112
-
113
-
114
-
115
-
116
-
117
-
118
-
119
-
120
-
121
-
122
-
123
-
124
-
125
-
126
-
127
-
128
-
129
-
130
-
131
-
132
-
133
-
134
-
135
 |
 |

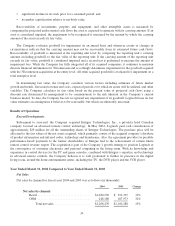
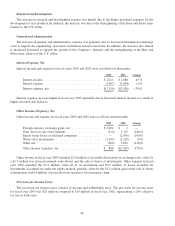
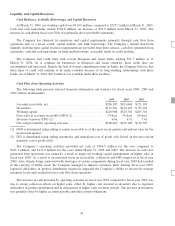
Provision for Income Taxes
During fiscal year 2004, the Company released $13.4 million of its tax valuation allowance on specific
deferred tax assets, primarily as a result of achieving sustained profitability in certain tax jurisdictions.
Additionally, a reassessment of its tax position resulted in the adjusting of its effective tax rate to 15% in its
March 2004 quarter from 20% in prior periods. This was primarily due to changes in the geographic income mix
subject to taxation. As a result of the release of its tax valuation allowance and the adjustment of its effective tax
rate, the Company’s provision for income taxes for fiscal year 2004 was $13.5 million, or a 9.3% effective tax
rate compared to $24.7 million for fiscal year 2003, or a 20% effective tax rate. Excluding the impact of the
$13.4 million valuation allowance released in the third quarter, the effective tax rate for fiscal year 2004 would
have been 18%.
Year Ended March 31, 2003 Compared to Year Ended March 31, 2002
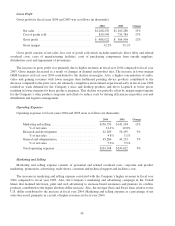
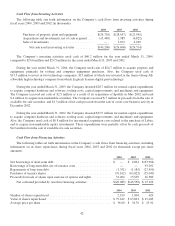
Net Sales
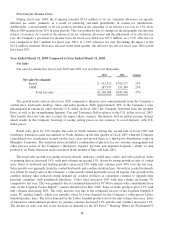
Net sales by channel for fiscal years 2003 and 2002 was as follows (in thousands):
2003 2002 Change
Net sales by channel:
Retail ................................... $ 912,315 $790,177 15%
OEM.................................... 187,973 153,369 23%
Total net sales ........................ $1,100,288 $943,546 17%
The growth in net sales in fiscal year 2003 compared to the prior year came primarily from the Company’s
corded mice, keyboards, desktop, video, and audio products. With approximately 49% of the Company’s sales
denominated in currencies other than the U.S. dollar in fiscal 2003, the Company benefited from the stronger
Euro, as well as the strengthening Japanese Yen and Taiwanese Dollar relative to the U.S. dollar in fiscal 2003.
This benefit does not take into account the impact these currency fluctuations had on global pricing strategy
which results in the Company lowering or raising selling prices in one currency to avoid disparity with U.S.
dollar prices.
Retail sales grew by 15% despite flat sales in North America during the second half of fiscal 2003 and
warehouse transition issues encountered in North America in the first quarter of fiscal 2003 when the Company
consolidated two warehouses located on the west coast and moved them to a third-party distribution center in
Memphis, Tennessee. The transition issues included a combination of physical lay out, systems, management and
other process issues at the Company’s third-party logistics provider and impeded Logitech’s ability to ship
product to its North American retail customers in the months of May and June 2002.
The retail sales growth was mainly from keyboards, desktops, corded mice, audio, and video products. Sales
of pointing devices increased 14%, with unit volumes increasing 13%, driven by strong growth in sales of corded
mice. Sales of keyboard and desktop products increased 24% while unit volumes grew 40% over the last year.
Sales growth was primarily from the corded keyboards and cordless desktop lines. Growth in corded keyboards
was driven by strong sales of the Company’s value priced corded keyboards across all regions. The growth in the
cordless desktop lines reflected strong demand for cordless products as consumers continue to upgrade their
personal computers with peripherals purchases. Video sales increased 16% with unit volume increasing 3%
compared to last year. This was primarily due to continued demand for PC Web cameras with contributions from
sales of the Logitech Pocket Digital™camera introduced in May 2002. Sales of audio products grew 13% with
unit volumes decreasing 28%. The sales increase was due to the continued success of the Logitech branded Z
series PC speaker family, which was partially offset by lower demand for the Company’s value-priced Labtec
branded product lines. The lower demand for the Labtec branded products drove the unit volume decreases. Sales
of interactive entertainment products for gaming consoles decreased 14% and the unit volumes increased 13%.
The decline in sales was due to the decrease in demand for the GT Force™Steering Wheel for PlayStation®2
38