Logitech 2004 Annual Report Download - page 44
Download and view the complete annual report
Please find page 44 of the 2004 Logitech annual report below. You can navigate through the pages in the report by either clicking on the pages listed below, or by using the keyword search tool below to find specific information within the annual report.-
 1
1 -
2
-
3
-
4
-
5
-
6
-
7
-
8
-
9
-
10
-
11
-
12
-
13
-
14
-
15
-
16
-
17
-
18
-
19
-
20
-
21
-
22
-
23
-
24
-
25
-
26
-
27
-
28
-
29
-
30
-
31
-
32
-
33
-
 34
34 -
 35
35 -
 36
36 -
 37
37 -
 38
38 -
 39
39 -
 40
40 -
 41
41 -
 42
42 -
 43
43 -
 44
44 -
 45
45 -
 46
46 -
 47
47 -
 48
48 -
 49
49 -
 50
50 -
 51
51 -
 52
52 -
 53
53 -
 54
54 -
55
-
56
-
57
-
58
-
59
-
60
-
61
-
62
-
63
-
64
-
65
-
66
-
67
-
68
-
69
-
70
-
71
-
72
-
73
-
74
-
75
-
76
-
77
-
78
-
79
-
80
-
81
-
82
-
83
-
84
-
85
-
86
-
87
-
88
-
89
-
90
-
91
-
92
-
93
-
94
-
95
-
96
-
97
-
98
-
99
-
100
-
101
-
102
-
103
-
104
-
105
-
106
-
107
-
108
-
109
-
110
-
111
-
112
-
113
-
114
-
115
-
116
-
117
-
118
-
119
-
120
-
121
-
122
-
123
-
124
-
125
-
126
-
127
-
128
-
129
-
130
-
131
-
132
-
133
-
134
-
135
 |
 |

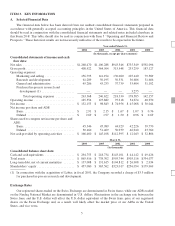
The following table sets forth for the periods indicated, information concerning exchange rates between the
U.S. dollar and Swiss franc based on the noon buying rate as reported by The Bank of New York, expressed in
Swiss francs per U.S. dollars. The noon buying rate is the rate in New York City for cable transfers in selected
currencies as certified for customs purposes by the Federal Reserve Bank of New York.
Average(1) High Low Period End
Fiscal 2000 .............................. CHF1.560 CHF1.663 CHF1.478 CHF1.663
Fiscal 2001 .............................. 1.697 1.830 1.590 1.736
Fiscal 2002 .............................. 1.699 1.819 1.586 1.682
Fiscal 2003 .............................. 1.469 1.674 1.325 1.354
Fiscal 2004 .............................. 1.311 1.418 1.219 1.268
(1) Represents the average of the noon buying rate on the last business day of each month during the respective
periods.
High Low
Monthly highs and lows (over the most recent six month period):
October 2003 .................................................. CHF1.335 CHF1.307
November 2003 ................................................ 1.374 1.299
December 2003 ................................................ 1.320 1.247
January 2004 .................................................. 1.266 1.219
February 2004 ................................................. 1.263 1.227
March 2004 ................................................... 1.304 1.240
B. Capitalization and Indebtedness
Not applicable.
C. Reasons for the Offer and Use of Proceeds
Not applicable.
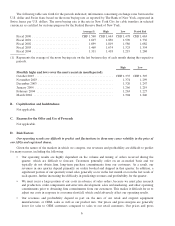
D. Risk Factors
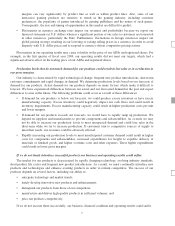
Our operating results are difficult to predict and fluctuations in them may cause volatility in the price of
our ADSs and registered shares.
Given the nature of the markets in which we compete, our revenues and profitability are difficult to predict
for many reasons, including the following:
• Our operating results are highly dependent on the volume and timing of orders received during the
quarter, which are difficult to forecast. Customers generally order on an as-needed basis and we
typically do not obtain firm, long-term purchase commitments from our customers. As a result, our
revenues in any quarter depend primarily on orders booked and shipped in that quarter. In addition, a
significant portion of our quarterly retail sales generally occur in the last month or even the last week of
each quarter, further increasing the difficulty in predicting revenues and profitability for the quarter.
• We must incur a large portion of our costs in advance of sales orders, because we must plan research
and production, order components and enter into development, sales and marketing, and other operating
commitments prior to obtaining firm commitments from our customers. This makes it difficult for us to
adjust our costs in response to a revenue shortfall, which could adversely affect our operating results.
• Our revenues and profitability depend in part on the mix of our retail and original equipment
manufacturers, or OEM, sales as well as our product mix. Our prices and gross margins are generally
lower for sales to OEM customers compared to sales to our retail customers. Our prices and gross
6