LinkedIn 2011 Annual Report Download - page 86
Download and view the complete annual report
Please find page 86 of the 2011 LinkedIn annual report below. You can navigate through the pages in the report by either clicking on the pages listed below, or by using the keyword search tool below to find specific information within the annual report.-
 1
1 -
2
-
3
-
4
-
5
-
6
-
7
-
8
-
9
-
10
-
11
-
12
-
13
-
14
-
15
-
16
-
17
-
18
-
19
-
20
-
21
-
22
-
23
-
24
-
25
-
26
-
27
-
28
-
29
-
30
-
31
-
32
-
33
-
34
-
35
-
36
-
37
-
38
-
39
-
40
-
41
-
42
-
43
-
44
-
45
-
46
-
47
-
48
-
49
-
50
-
51
-
52
-
53
-
54
-
55
-
56
-
57
-
58
-
59
-
60
-
61
-
62
-
63
-
64
-
65
-
66
-
67
-
68
-
69
-
70
-
71
-
72
-
73
-
74
-
75
-
 76
76 -
 77
77 -
 78
78 -
 79
79 -
 80
80 -
 81
81 -
 82
82 -
 83
83 -
 84
84 -
 85
85 -
 86
86 -
 87
87 -
 88
88 -
 89
89 -
 90
90 -
 91
91 -
 92
92 -
 93
93 -
 94
94 -
 95
95 -
 96
96 -
97
-
98
-
99
-
100
-
101
-
102
-
103
-
104
-
105
-
106
-
107
-
108
-
109
-
110
-
111
-
112
 |
 |

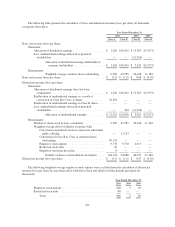
The following table presents the calculation of basic and diluted net income (loss) per share (in thousands,
except per share data):
Year Ended December 31,
2011 2010 2009
Class A Class B Class B Class B
Basic net income (loss) per share:
Numerator:
Allocation of distributed earnings ...................... $ 1,420 $10,492 $ 15,385 $ (3,973)
Less: undistributed earnings allocated to preferred
stockholders ..................................... — — (11,956) —
Allocation of distributed earnings attributable to
common stockholders ..................... $ 1,420 $10,492 $ 3,429 $ (3,973)
Denominator:
Weighted-average common shares outstanding . . . 9,200 67,985 42,446 41,184
Basic net income (loss) per share .............................. $ 0.15 $ 0.15 $ 0.08 $ (0.10)
Diluted net income (loss) per share:
Numerator:
Allocation of distributed earnings (loss) for basic
computation ..................................... $ 1,420 $10,492 $ 15,385 $ (3,973)
Reallocation of undistributed earnings as a result of
conversion of Class B to Class A shares ............... 10,492 — — —
Reallocation of undistributed earnings to Class B shares .... — — — —
Less: undistributed earnings allocated to preferred
stockholders..................................... — 364 (11,956) —
Allocation of undistributed earnings ............ $ 11,912 $10,856 $ 3,429 $ (3,973)
Denominator:
Number of shares used in basic calculation .............. 9,200 67,985 42,446 41,184
Weighted average effect of dilutive securities Add:
Conversion of preferred stock in connection with initial
public offering ............................... — 17,133 — —
Conversion of Class B to Class A common shares
outstanding ................................. 85,118 — — —
Employee stock options ......................... 9,770 9,770 4,013 —
Restricted stock units . . . . . . . . . . . . . . . . . . . . . . . . . . . 22 — — —
Employee stock purchase plan .................... 8 — — —
Number of shares used in diluted calculation ..... 104,118 94,888 46,459 41,184
Diluted net income (loss) per share ............................. $ 0.11 $ 0.11 $ 0.07 $ (0.10)
The following weighted-average employee stock options were excluded from the calculation of diluted net
income (loss) per share because their effect would have been anti-dilutive for the periods presented (in
thousands):
Year Ended December 31,
2011 2010 2009
Employeestockoptions................................... 418 3 10
Restrictedstockunits..................................... 88 — —
Total.............................................. 506 3 10
-82-