LinkedIn 2011 Annual Report Download - page 72
Download and view the complete annual report
Please find page 72 of the 2011 LinkedIn annual report below. You can navigate through the pages in the report by either clicking on the pages listed below, or by using the keyword search tool below to find specific information within the annual report.-
 1
1 -
2
-
3
-
4
-
5
-
6
-
7
-
8
-
9
-
10
-
11
-
12
-
13
-
14
-
15
-
16
-
17
-
18
-
19
-
20
-
21
-
22
-
23
-
24
-
25
-
26
-
27
-
28
-
29
-
30
-
31
-
32
-
33
-
34
-
35
-
36
-
37
-
38
-
39
-
40
-
41
-
42
-
43
-
44
-
45
-
46
-
47
-
48
-
49
-
50
-
51
-
52
-
53
-
54
-
55
-
56
-
57
-
58
-
59
-
60
-
61
-
 62
62 -
 63
63 -
 64
64 -
 65
65 -
 66
66 -
 67
67 -
 68
68 -
 69
69 -
 70
70 -
 71
71 -
 72
72 -
 73
73 -
 74
74 -
 75
75 -
 76
76 -
 77
77 -
 78
78 -
 79
79 -
 80
80 -
 81
81 -
 82
82 -
83
-
84
-
85
-
86
-
87
-
88
-
89
-
90
-
91
-
92
-
93
-
94
-
95
-
96
-
97
-
98
-
99
-
100
-
101
-
102
-
103
-
104
-
105
-
106
-
107
-
108
-
109
-
110
-
111
-
112
 |
 |

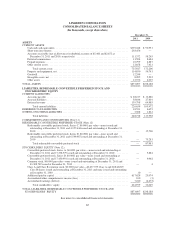
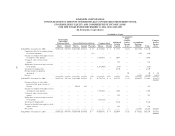
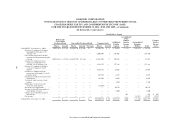
LINKEDIN CORPORATION
CONSOLIDATED STATEMENTS OF REDEEMABLE CONVERTIBLE PREFERRED STOCK,
STOCKHOLDERS’ EQUITY AND COMPREHENSIVE INCOME (LOSS)
FOR THE YEARS ENDED DECEMBER 31, 2011, 2010 AND 2009—(Continued)
(In thousands, except shares)
Stockholders’ Equity
Redeemable
Convertible
Preferred Stock Convertible Preferred Stock Common Stock Additional
Paid-In
Capital
Accumulated
Other
Compre-
hensive
Income
(Loss)
Accumulated
Earnings
(Deficit) Total
Compre-
hensive
Income
(Loss)Shares Amount Shares Amount Warrants Shares Amount
BALANCE—December 31, 2010 ...... 10,957,631 $ 87,981 34,689,570 $ 15,846 $— 43,308,742 $ 4 $ 25,074 $ (3) $ (4,672) $ 36,249
Issuance of common stock upon
initial public offering, net of
offering costs ................ — — — — — 6,003,804 1 248,405 — — 248,406
Conversion of preferred stock to
common stock upon initial public
offering ..................... (10,957,631) (87,981) (34,689,570) (15,846) — 45,647,201 5 103,822 — — 87,981
Issuance of common stock in
connection with follow-on
offering, net of offering costs .... — — — — — 2,583,755 — 177,318 — — 177,318
Issuance of common stock upon
exercise of employee stock
options ..................... — — — — — 3,665,152 — 13,068 — — 13,068
Issuance of common stock in
connection with employee stock
purchase plan ................ — — — — — 164,367 — 6,287 — — 6,287
Issuance of common stock related to
acquisitions .................. — — — — — 129,203 — 8,059 — — 8,059
Vesting of early exercised stock
options ..................... — — — — — — — 3,704 — — 3,704
Repurchase of unvested early
exercised stock options ......... — — — — — (21,830) — — — — —
Stock-based compensation ........ — — — — — — — 30,292 — — 30,292
Income tax benefit from employee
stock option exercises .......... — — — — — — — 1,600 — — 1,600
Change in net unrealized gain on
investments . . . . . . . . . . . . . . . . . . — — — — — — — — 103 — 103 $ 103
Net income .................... — — — — — — — — — 11,912 11,912 11,912
BALANCE—December 31, 2011 . . . . . . — $ — — $ — $— 101,480,394 $ 10 $617,629 $100 $ 7,240 $624,979 $12,015
See notes to consolidated financial statements.
68