LinkedIn 2011 Annual Report Download - page 45
Download and view the complete annual report
Please find page 45 of the 2011 LinkedIn annual report below. You can navigate through the pages in the report by either clicking on the pages listed below, or by using the keyword search tool below to find specific information within the annual report.-
 1
1 -
2
-
3
-
4
-
5
-
6
-
7
-
8
-
9
-
10
-
11
-
12
-
13
-
14
-
15
-
16
-
17
-
18
-
19
-
20
-
21
-
22
-
23
-
24
-
25
-
26
-
27
-
28
-
29
-
30
-
31
-
32
-
33
-
34
-
 35
35 -
 36
36 -
 37
37 -
 38
38 -
 39
39 -
 40
40 -
 41
41 -
 42
42 -
 43
43 -
 44
44 -
 45
45 -
 46
46 -
 47
47 -
 48
48 -
 49
49 -
 50
50 -
 51
51 -
 52
52 -
 53
53 -
 54
54 -
 55
55 -
56
-
57
-
58
-
59
-
60
-
61
-
62
-
63
-
64
-
65
-
66
-
67
-
68
-
69
-
70
-
71
-
72
-
73
-
74
-
75
-
76
-
77
-
78
-
79
-
80
-
81
-
82
-
83
-
84
-
85
-
86
-
87
-
88
-
89
-
90
-
91
-
92
-
93
-
94
-
95
-
96
-
97
-
98
-
99
-
100
-
101
-
102
-
103
-
104
-
105
-
106
-
107
-
108
-
109
-
110
-
111
-
112
 |
 |

• adjusted EBITDA does not consider the potentially dilutive impact of equity-based compensation;
• adjusted EBITDA does not reflect tax payments that may represent a reduction in cash available to us;
and
• other companies, including companies in our industry, may calculate adjusted EBITDA differently,
which reduces its usefulness as a comparative measure.
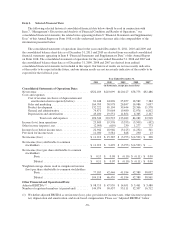
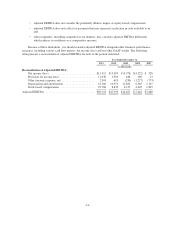
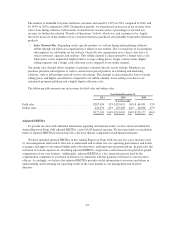
Because of these limitations, you should consider adjusted EBITDA alongside other financial performance
measures, including various cash flow metrics, net income (loss) and our other GAAP results. The following
table presents a reconciliation of adjusted EBITDA for each of the periods indicated:
Year Ended December 31,
2011 2010 2009 2008 2007
(in thousands)
Reconciliation of Adjusted EBITDA:
Net income (loss) ............................... $11,912 $15,385 $ (3,973) $(4,522) $ 328
Provision for income taxes ........................ 11,030 3,581 848 290 13
Other (income) expense, net ....................... 2,903 610 (230) (1,277) (773)
Depreciation and amortization ..................... 43,100 19,551 11,854 6,365 2,107
Stock-based compensation ........................ 29,768 8,832 6,152 4,605 1,805
Adjusted EBITDA .................................. $98,713 $47,959 $14,651 $ 5,461 $3,480
-41-