LinkedIn 2011 Annual Report Download - page 55
Download and view the complete annual report
Please find page 55 of the 2011 LinkedIn annual report below. You can navigate through the pages in the report by either clicking on the pages listed below, or by using the keyword search tool below to find specific information within the annual report.-
 1
1 -
2
-
3
-
4
-
5
-
6
-
7
-
8
-
9
-
10
-
11
-
12
-
13
-
14
-
15
-
16
-
17
-
18
-
19
-
20
-
21
-
22
-
23
-
24
-
25
-
26
-
27
-
28
-
29
-
30
-
31
-
32
-
33
-
34
-
35
-
36
-
37
-
38
-
39
-
40
-
41
-
42
-
43
-
44
-
 45
45 -
 46
46 -
 47
47 -
 48
48 -
 49
49 -
 50
50 -
 51
51 -
 52
52 -
 53
53 -
 54
54 -
 55
55 -
 56
56 -
 57
57 -
 58
58 -
 59
59 -
 60
60 -
 61
61 -
 62
62 -
 63
63 -
 64
64 -
 65
65 -
66
-
67
-
68
-
69
-
70
-
71
-
72
-
73
-
74
-
75
-
76
-
77
-
78
-
79
-
80
-
81
-
82
-
83
-
84
-
85
-
86
-
87
-
88
-
89
-
90
-
91
-
92
-
93
-
94
-
95
-
96
-
97
-
98
-
99
-
100
-
101
-
102
-
103
-
104
-
105
-
106
-
107
-
108
-
109
-
110
-
111
-
112
 |
 |

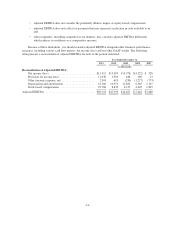
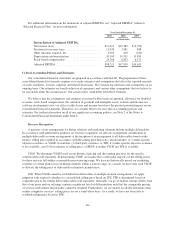
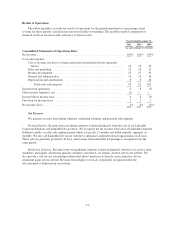
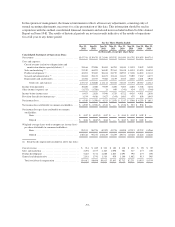
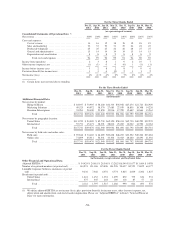
Results of Operations
The following tables set forth our results of operations for the periods presented as a percentage of net
revenue for those periods (certain items may not total due to rounding). The period-to-period comparison of
financial results is not necessarily indicative of future results.
Year Ended December 31,
2011 2010 2009
(as a percentage of revenue)
Consolidated Statements of Operations Data:
Net revenue ............................................................ 100% 100% 100%
Costs and expenses:
Cost of revenue (exclusive of depreciation and amortization shown separately
below) .......................................................... 16 18 22
Salesandmarketing ................................................. 32 24 22
Productdevelopment................................................. 25 27 33
Generalandadministrative ............................................ 14 14 16
Depreciationandamortization ......................................... 8 8 10
Totalcostsandexpenses .......................................... 95 92 103
Incomefromoperations .................................................. 5 8 (3)
Otherincome(expense),net ............................................... (1) — —
Incomebeforeincometaxes ............................................... 4 8 (3)
Provision for income taxes ................................................ 2 1 1
Netincome(loss) ....................................................... 2% 6% (3)%
Net Revenue
We generate revenue from hiring solutions, marketing solutions and premium subscriptions.
Hiring Solutions. Revenue from our hiring solutions is derived primarily from the sale of our LinkedIn
Corporate Solutions and LinkedIn Jobs products. We recognize the net revenue from sales of LinkedIn Corporate
Solutions ratably over the subscription period, which is typically 12 months and billed annually, quarterly or
monthly. We also sell LinkedIn Jobs on our website to enterprises and professional organizations of all sizes.
These jobs are generally posted for 30 days, and revenue from individual job postings is recognized over the
same period.
Marketing Solutions. Revenue from our marketing solutions is derived primarily from fees we receive from
marketers, principally advertising agencies and direct advertisers, for display and text ads on our website. We
also provide a self-service advertising solution that allows marketers to directly create and place ads on
prominent pages on our website. Revenue from display or text ads is generally recognized when the
advertisement is displayed on our website.
-51-