LinkedIn 2011 Annual Report Download - page 57
Download and view the complete annual report
Please find page 57 of the 2011 LinkedIn annual report below. You can navigate through the pages in the report by either clicking on the pages listed below, or by using the keyword search tool below to find specific information within the annual report.-
 1
1 -
2
-
3
-
4
-
5
-
6
-
7
-
8
-
9
-
10
-
11
-
12
-
13
-
14
-
15
-
16
-
17
-
18
-
19
-
20
-
21
-
22
-
23
-
24
-
25
-
26
-
27
-
28
-
29
-
30
-
31
-
32
-
33
-
34
-
35
-
36
-
37
-
38
-
39
-
40
-
41
-
42
-
43
-
44
-
45
-
46
-
 47
47 -
 48
48 -
 49
49 -
 50
50 -
 51
51 -
 52
52 -
 53
53 -
 54
54 -
 55
55 -
 56
56 -
 57
57 -
 58
58 -
 59
59 -
 60
60 -
 61
61 -
 62
62 -
 63
63 -
 64
64 -
 65
65 -
 66
66 -
 67
67 -
68
-
69
-
70
-
71
-
72
-
73
-
74
-
75
-
76
-
77
-
78
-
79
-
80
-
81
-
82
-
83
-
84
-
85
-
86
-
87
-
88
-
89
-
90
-
91
-
92
-
93
-
94
-
95
-
96
-
97
-
98
-
99
-
100
-
101
-
102
-
103
-
104
-
105
-
106
-
107
-
108
-
109
-
110
-
111
-
112
 |
 |

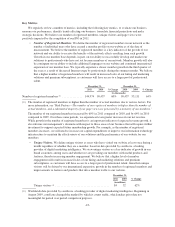
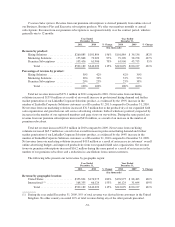
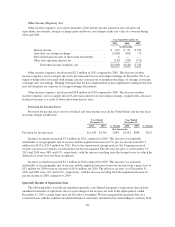
International revenue increased $102.2 million in 2011 compared to 2010 and $34.5 million in 2010
compared to 2009. In addition, international revenue represented 32% of total revenue in 2011 compared to 27%
of total revenue in 2010. The increases in international revenue are primarily due to the expansion of our
international field sales organization and our site localization efforts. In 2011, we launched eight local languages,
bringing the total to fourteen local languages as of December 31, 2011, and opened an additional seven offices
outside of the United States. We expect international revenue to increase on an absolute basis and as a percentage
of revenue in 2012 as we continue to focus on making our platform available in more languages and further
developing our brand across various international geographies.
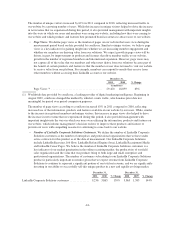
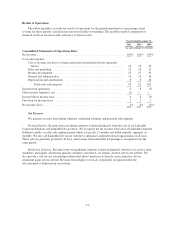
Cost of Revenue
Our cost of revenue primarily consists of web hosting costs related to operating our website and salaries,
benefits and stock-based compensation for our production operations, customer support, infrastructure and
advertising operations teams. Credit card processing fees, direct costs related to our research products, certain
uncollected valued added taxes, or VAT, and sales taxes, allocated facilities costs, costs related to solutions offered
to our customers in our production environment, and other supporting overhead costs are also included in cost of
revenue. Beginning in the fourth quarter of 2011, we began to pass through VAT and sales tax to our customers on
all our products. We currently expect cost of revenue to increase on an absolute basis, but to decrease as a
percentage of revenue in the near term as we continue to pass through VAT and sales tax to our customers.
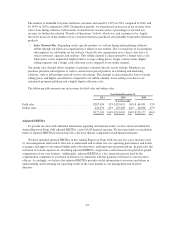
Year Ended
December 31,
Year Ended
December 31,
2011 2010 % Change 2010 2009 % Change
($ in thousands)
Cost of revenue .......................... $81,448 $44,826 82% $44,826 $25,857 73%
Percentage of net revenue . . . . . . . . . . . . . . . . . 16% 18% 18% 22%
Headcount (at period end): . . . . . . . . . . . . . . . . . 338 141 140% 141 86 64%
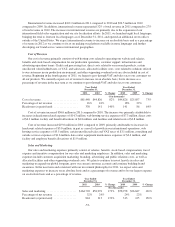
Cost of revenue increased $36.6 million in 2011 compared to 2010. The increase was primarily attributable to
increases in headcount related expenses of $14.3 million, web hosting service expenses of $7.3 million, direct costs
of $4.3 million, facility and benefit allocations of $4.8 million, and facilities and related costs of $2.8 million.
Cost of revenue increased $19.0 million in 2010 compared to 2009, primarily attributable to increases in
headcount related expenses of $5.0 million, in part as a result of growth in our international operations, web
hosting service expenses of $3.5 million, certain uncollected sales and VAT taxes of $3.1 million, consulting and
outside services expenses of $1.6 million, data center equipment maintenance expenses of $2.4 million, and
facility and employee benefit allocations of $1.9 million.
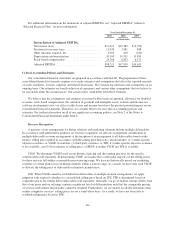
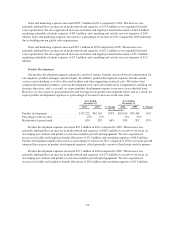
Sales and Marketing
Our sales and marketing expenses primarily consist of salaries, benefits, stock-based compensation, travel
expense and incentive compensation for our sales and marketing employees. In addition, sales and marketing
expenses include customer acquisition marketing, branding, advertising and public relations costs, as well as
allocated facilities and other supporting overhead costs. We plan to continue to invest heavily in sales and
marketing to expand our global footprint, grow our current customer accounts and continue building brand
awareness. In the near term and consistent with our investment philosophy for 2011, we expect sales and
marketing expenses to increase on an absolute basis and as a percentage of revenue and to be our largest expense
on an absolute basis and as a percentage of revenue.
Year Ended
December 31,
Year Ended
December 31,
2011 2010 % Change 2010 2009 % Change
($ in thousands)
Sales and marketing ..................... $164,703 $58,978 179% $58,978 $26,847 120%
Percentage of net revenue . . . . . . . . . . . . . . . . 32% 24% 24% 22%
Headcount (at period end): . . . . . . . . . . . . . . . . 844 313 170% 313 125 150%
-53-