LinkedIn 2011 Annual Report Download - page 58
Download and view the complete annual report
Please find page 58 of the 2011 LinkedIn annual report below. You can navigate through the pages in the report by either clicking on the pages listed below, or by using the keyword search tool below to find specific information within the annual report.-
 1
1 -
2
-
3
-
4
-
5
-
6
-
7
-
8
-
9
-
10
-
11
-
12
-
13
-
14
-
15
-
16
-
17
-
18
-
19
-
20
-
21
-
22
-
23
-
24
-
25
-
26
-
27
-
28
-
29
-
30
-
31
-
32
-
33
-
34
-
35
-
36
-
37
-
38
-
39
-
40
-
41
-
42
-
43
-
44
-
45
-
46
-
47
-
 48
48 -
 49
49 -
 50
50 -
 51
51 -
 52
52 -
 53
53 -
 54
54 -
 55
55 -
 56
56 -
 57
57 -
 58
58 -
 59
59 -
 60
60 -
 61
61 -
 62
62 -
 63
63 -
 64
64 -
 65
65 -
 66
66 -
 67
67 -
 68
68 -
69
-
70
-
71
-
72
-
73
-
74
-
75
-
76
-
77
-
78
-
79
-
80
-
81
-
82
-
83
-
84
-
85
-
86
-
87
-
88
-
89
-
90
-
91
-
92
-
93
-
94
-
95
-
96
-
97
-
98
-
99
-
100
-
101
-
102
-
103
-
104
-
105
-
106
-
107
-
108
-
109
-
110
-
111
-
112
 |
 |

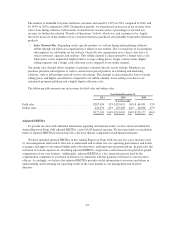
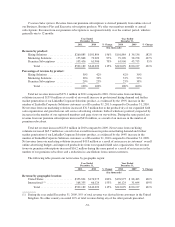
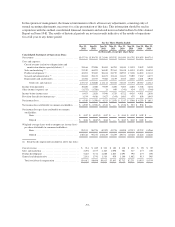
Sales and marketing expenses increased $105.7 million in 2011 compared to 2010. The increase was
primarily attributable to an increase in headcount related expenses of $75.4 million as we expanded our field
sales organization. We also experienced increases in facility and employee benefit allocations of $16.4 million,
marketing and public relations expenses of $8.1 million, and consulting and outside services expenses of $4.0
million. Sales and marketing expenses increased as a percentage of revenue in 2011 compared to 2010 primarily
due to building out our global sales organization.
Sales and marketing expenses increased $32.1 million in 2010 compared to 2009. The increase was
primarily attributable to an increase in headcount related expenses of $21.2 million as we expanded our field
sales organization. We also experienced increases in facility and employee benefit allocations of $5.5 million,
marketing and public relations expenses of $3.1 million, and consulting and outside services expenses of $1.5
million.
Product Development
Our product development expenses primarily consist of salaries, benefits and stock-based compensation for
our engineers, product managers and developers. In addition, product development expenses include outside
services and consulting, as well as allocated facilities and other supporting overhead costs. We believe that
continued investment in features, software development tools and code modification is important to attaining our
strategic objectives, and, as a result, we expect product development expense to increase on an absolute basis.
However, we also expect to gain productivity and leverage in our product development efforts and as a result, we
expect product development expenses as a percentage of revenue to decrease in the near term.
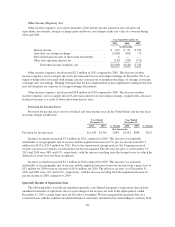
Year Ended
December 31,
Year Ended
December 31,
2011 2010 % Change 2010 2009 % Change
($ in thousands)
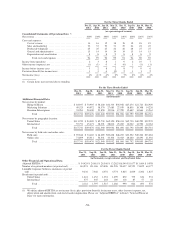
Product development .................... $132,222 $65,104 103% $65,104 $39,444 65%
Percentage of net revenue . . . . . . . . . . . . . . . . 25% 27% 27% 33%
Headcount (at period end): . . . . . . . . . . . . . . . . 634 383 66% 383 207 85%
Product development expenses increased $67.1 million in 2011 compared to 2010. The increase was
primarily attributable to an increase in headcount related expenses of $48.3 million as a result of our focus on
developing new features and products to increase member growth and engagement. We also experienced
increases in facility and employee benefit allocations of $9.1 million and consulting expenses of $6.8 million.
Product development expense decreased as a percentage of revenue in 2011 compared to 2010 as revenue growth
outpaced the increase in product development expenses, which primarily consists of headcount related expenses.
Product development expenses increased $25.7 million in 2010 compared to 2009. The increase was
primarily attributable to an increase in headcount related expenses of $17.4 million as a result of our focus on
developing new features and products to increase member growth and engagement. We also experienced
increases in facility and employee benefit allocations of $6.0 million and consulting expenses of $1.4 million.
-54-