LinkedIn 2011 Annual Report Download - page 56
Download and view the complete annual report
Please find page 56 of the 2011 LinkedIn annual report below. You can navigate through the pages in the report by either clicking on the pages listed below, or by using the keyword search tool below to find specific information within the annual report.-
 1
1 -
2
-
3
-
4
-
5
-
6
-
7
-
8
-
9
-
10
-
11
-
12
-
13
-
14
-
15
-
16
-
17
-
18
-
19
-
20
-
21
-
22
-
23
-
24
-
25
-
26
-
27
-
28
-
29
-
30
-
31
-
32
-
33
-
34
-
35
-
36
-
37
-
38
-
39
-
40
-
41
-
42
-
43
-
44
-
45
-
 46
46 -
 47
47 -
 48
48 -
 49
49 -
 50
50 -
 51
51 -
 52
52 -
 53
53 -
 54
54 -
 55
55 -
 56
56 -
 57
57 -
 58
58 -
 59
59 -
 60
60 -
 61
61 -
 62
62 -
 63
63 -
 64
64 -
 65
65 -
 66
66 -
67
-
68
-
69
-
70
-
71
-
72
-
73
-
74
-
75
-
76
-
77
-
78
-
79
-
80
-
81
-
82
-
83
-
84
-
85
-
86
-
87
-
88
-
89
-
90
-
91
-
92
-
93
-
94
-
95
-
96
-
97
-
98
-
99
-
100
-
101
-
102
-
103
-
104
-
105
-
106
-
107
-
108
-
109
-
110
-
111
-
112
 |
 |

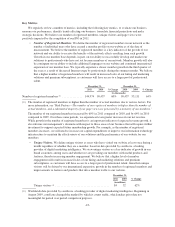
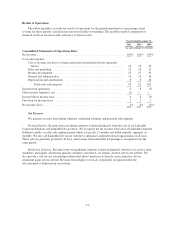
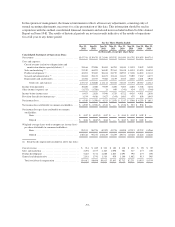
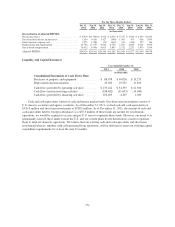
Premium Subscriptions. Revenue from our premium subscriptions is derived primarily from online sales of
our Business, Business Plus and Executive subscription products. We offer our members monthly or annual
subscriptions. Revenue from our premium subscriptions is recognized ratably over the contract period, which is
generally one to 12 months.
Year Ended
December 31,
Year Ended
December 31,
2011 2010 % Change 2010 2009 % Change
($ in thousands)
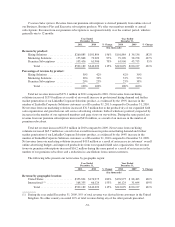
Revenue by product:
Hiring Solutions ................. $260,885 $101,884 156% $101,884 $ 36,136 182%
Marketing Solutions .............. 155,848 79,309 97% 79,309 38,278 107%
Premium Subscriptions ........... 105,456 61,906 70% 61,906 45,713 35%
Total ...................... $522,189 $243,099 115% $243,099 $120,127 102%
Percentage of revenue by product:
Hiring Solutions . . . . . . . . . . . . . . . . . 50% 42% 42% 30%
Marketing Solutions . . . . . . . . . . . . . . 30% 33% 33% 32%
Premium Subscriptions . . . . . . . . . . . 20% 25% 25% 38%
Total ...................... 100% 100% 100% 100%
Total net revenue increased $279.1 million in 2011 compared to 2010. Net revenue from our hiring
solutions increased $159.0 million as a result of an overall increase in professional hiring demand and further
market penetration of our LinkedIn Corporate Solutions product, as evidenced by the 139% increase in the
number of LinkedIn Corporate Solutions customers as of December 31, 2011 compared to December 31, 2010.
Net revenue from our marketing solutions increased $76.5 million due to the productivity of our expanded field
sales organization and growth in our self service advertising solutions, both of which are positively impacted by
increases in the number of our registered members and page views on our website. During the same period, net
revenue from our premium subscriptions increased $43.6 million, as a result of an increase in the number of
premium subscribers.
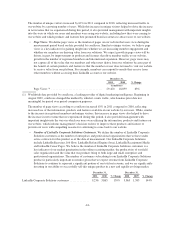
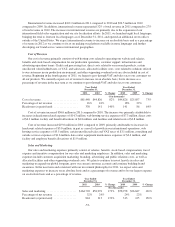
Total net revenue increased $123.0 million in 2010 compared to 2009. Net revenue from our hiring
solutions increased $65.7 million as a result of an overall increase in professional hiring demand and further
market penetration of our LinkedIn Corporate Solutions product, as evidenced by the 144% increase in the
number of LinkedIn Corporate Solutions customers as of December 31, 2010 compared to December 31, 2009.
Net revenue from our marketing solutions increased $41.0 million as a result of an increase in customers’ overall
online advertising budgets and improved productivity from our expanded field sales organization. Net revenue
from our premium subscriptions increased $16.2 million during the same period as a result of an increase in the
number of our premium subscribers and a reduction in cancellations from current customers.
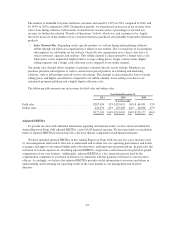
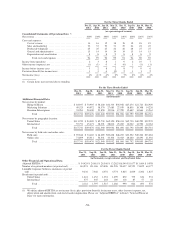
The following table presents our net revenue by geographic region:
Year Ended
December 31,
Year Ended
December 31,
2011 2010 % Change 2010 2009 % Change
($ in thousands)
Revenue by geographic location:
United States ................... $353,834 $176,975 100% $176,975 $ 88,483 100%
International (1) .................. 168,355 66,124 155% 66,124 31,644 109%
Total ...................... $522,189 $243,099 115% $243,099 $120,127 102%
(1) During the year ended December 31, 2009, 10% of total revenue was derived from customers in the United
Kingdom. No other country exceeded 10% of total revenue during any of the other periods presented.
-52-