LinkedIn 2011 Annual Report Download - page 61
Download and view the complete annual report
Please find page 61 of the 2011 LinkedIn annual report below. You can navigate through the pages in the report by either clicking on the pages listed below, or by using the keyword search tool below to find specific information within the annual report.-
 1
1 -
2
-
3
-
4
-
5
-
6
-
7
-
8
-
9
-
10
-
11
-
12
-
13
-
14
-
15
-
16
-
17
-
18
-
19
-
20
-
21
-
22
-
23
-
24
-
25
-
26
-
27
-
28
-
29
-
30
-
31
-
32
-
33
-
34
-
35
-
36
-
37
-
38
-
39
-
40
-
41
-
42
-
43
-
44
-
45
-
46
-
47
-
48
-
49
-
50
-
 51
51 -
 52
52 -
 53
53 -
 54
54 -
 55
55 -
 56
56 -
 57
57 -
 58
58 -
 59
59 -
 60
60 -
 61
61 -
 62
62 -
 63
63 -
 64
64 -
 65
65 -
 66
66 -
 67
67 -
 68
68 -
 69
69 -
 70
70 -
 71
71 -
72
-
73
-
74
-
75
-
76
-
77
-
78
-
79
-
80
-
81
-
82
-
83
-
84
-
85
-
86
-
87
-
88
-
89
-
90
-
91
-
92
-
93
-
94
-
95
-
96
-
97
-
98
-
99
-
100
-
101
-
102
-
103
-
104
-
105
-
106
-
107
-
108
-
109
-
110
-
111
-
112
 |
 |
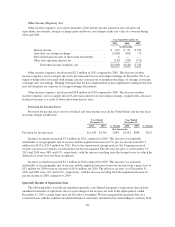
In the opinion of management, the financial information reflects all necessary adjustments, consisting only of
normal recurring adjustments, necessary for a fair presentation of this data. This information should be read in
conjunction with the audited consolidated financial statements and related notes included in Item 8 of this Annual
Report on Form 10-K. The results of historical periods are not necessarily indicative of the results of operations
for a full year or any future period.
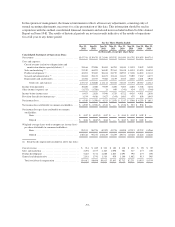
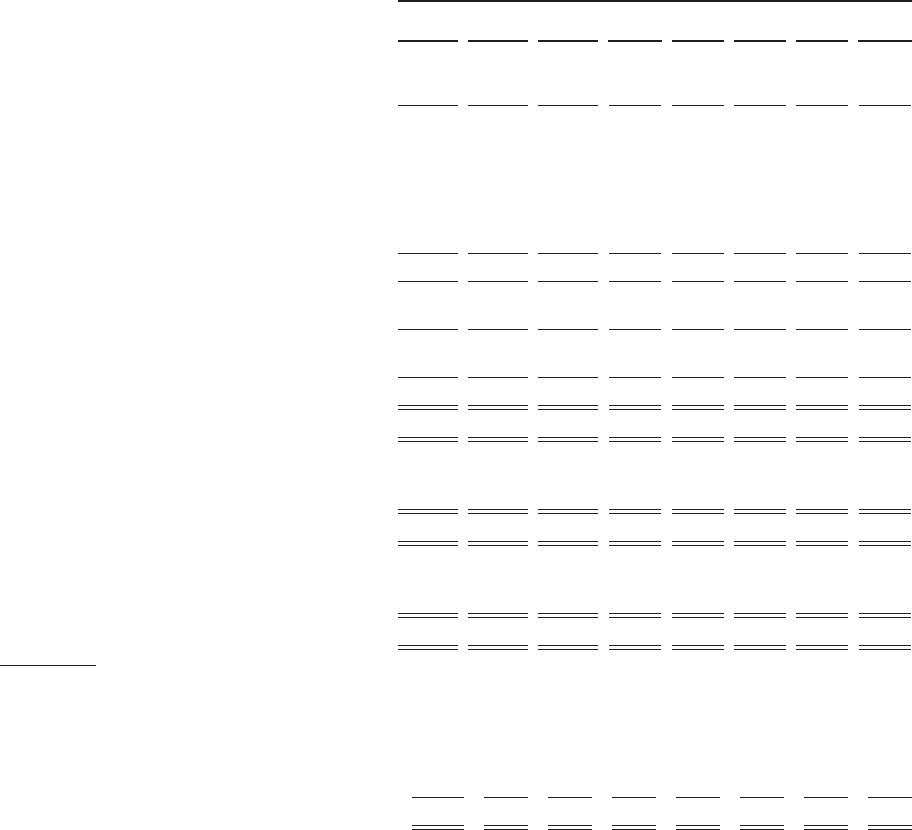
For the Three Months Ended
Dec 31,
2011
Sep 30,
2011
Jun 30,
2011
Mar 31,
2011
Dec 31,
2010
Sep 30,
2010
Jun 30,
2010
Mar 31,
2010
(in thousands, except per share data)
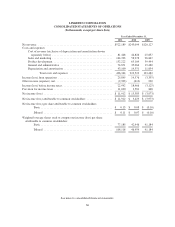
Consolidated Statements of Operations Data:
Net revenue ...................................... $167,741 $139,476 $121,040 $93,932 $81,696 $61,792 $54,895 $44,716
Costs and expenses:
Cost of revenue (exclusive of depreciation and
amortization shown separately below) (1) ........... 24,166 22,096 18,403 16,783 14,844 11,835 9,842 8,305
Sales and marketing (1) ............................ 53,249 46,074 36,019 29,361 20,638 14,831 13,055 10,454
Product development (1) ........................... 42,051 35,022 30,414 24,735 20,953 17,188 14,822 12,141
General and administrative (1) ...................... 24,463 20,121 16,673 13,614 11,633 9,092 7,667 6,672
Depreciation and amortization ...................... 13,784 11,555 9,602 8,159 6,565 4,845 4,201 3,940
Total costs and expenses ...................... 157,713 134,868 111,111 92,652 74,633 57,791 49,587 41,512
Income from operations ............................. 10,028 4,608 9,929 1,280 7,063 4,001 5,308 3,204
Other income (expense), net ......................... (1,575) (1,788) 11 449 (341) 434 (357) (346)
Income before income taxes ......................... 8,453 2,820 9,940 1,729 6,722 4,435 4,951 2,858
Provision (benefit) for income taxes ................... 1,534 4,418 5,427 (349) 1,405 475 658 1,043
Net income (loss) .................................. $ 6,919 $ (1,598) $ 4,513 $ 2,078 $ 5,317 $ 3,960 $ 4,293 $ 1,815
Net income (loss) attributable to common stockholders .... $ 6,919 $ (1,598) $ 4,513 $ — $ 1,576 $ 915 $ 938 $ —
Net income (loss) per share attributable to common
stockholders:
Basic ...................................... $ 0.07 $ (0.02) $ 0.07 $ — $ 0.04 $ 0.02 $ 0.02 $ —
Diluted .................................... $ 0.06 $ (0.02) $ 0.04 $ — $ 0.03 $ 0.02 $ 0.02 $ —
Weighted-average shares used to compute net income (loss)
per share attributable to common stockholders:
Basic ...................................... 98,531 96,276 69,395 43,726 43,058 42,515 42,232 41,966
Diluted .................................... 108,612 96,276 103,129 51,459 49,372 46,601 45,624 44,228
(1) Stock-based compensation included in above line items:
Cost of revenue . . . . . . . . . . . . . . . . . . . . . . . . . . . . . . . . . . . . $ 714 $ 469 $ 312 $ 183 $ 138 $ 122 $ 90 $ 89
Sales and marketing ................................ 2,294 2,577 2,105 1,098 381 317 277 250
Product development ............................... 5,423 3,711 2,888 1,603 1,093 790 675 690
General and administrative ........................... 2,181 1,741 1,510 959 1,100 1,002 913 905
Total stock-based compensation ..................... $10,612 $8,498 $6,815 $3,843 $2,712 $2,231 $1,955 $1,934
-57-